javacodegeeks.com /3 weeks ago

Understanding OpenTelemetry: How It Works End to End

OpenTelemetry (OTel) is a vendor-neutral, open-source standard for collecting traces, metrics, and logs from an application — collectively called telemetry. Before OTel, every obse...


Read source
snowflake.com /1 month ago

OpenTelemetry as an Enterprise Data Asset | Snowflake

Learn how to turn telemetry into a governed enterprise data asset. See how Observe by Snowflake and the Snowflake AI Data Cloud help teams connect operational signals with business...

Read source
snowflake.com /1 month ago

エンタープライズデータ資産としてのOpenTelemetry | Snowflake

テレメトリをガバナンスの効いたエンタープライズデータ資産に変える方法をご紹介します。Observe by SnowflakeとSnowflake AI Data Cloudが、アナリティクスとAIのために運用シグナルとビジネ...

Read source
cncf.io /1 month ago

Filtering and reducing AI agent telemetry with the OpenTelemetry Collector

Turn on an AI coding agent’s telemetry and it throws a wall of text at you. It’s expensive to store and what’s worse, you can’t make sense of it. It’s all OpenTelemetry native, tho...

Read source
cncf.io /3 weeks ago

OpenTelemetry-powered distributed tracing and Kubernetes events in OpenChoreo

Getting code from a developer’s editor into production means building it, testing it, deploying it, and then understanding how it behaves once it’s running. Internal Developer Plat...

Read source
planetmainframe.com /1 week ago

OpenTelemetry for IBM z/OS Explained

The post OpenTelemetry for IBM z/OS Explained appeared first on Planet Mainframe.

Read source
testmuai.com /1 month ago

OpenTelemetry LLM Metrics Taxonomy: GenAI Names and Status

OpenTelemetry LLM metrics taxonomy: every GenAI metric name, instrument, unit and bucket, what v1.41.0 released, what main renamed since, and what to emit.

Read source
cncf.io /5 days ago

Is your OpenTelemetry pipeline becoming a performance bottleneck?

At Cloud Native Days Austria 2026, I presented a talk called How to Defeat OTel’s Silent Killer: The Performance Overhead, exploring a problem that is easy to overlook when buildin...

Read source
databricks.com /2 weeks ago

Claude Platform now supports native OpenTelemetry observability in Databricks MLflow

An agent can return a plausible answer while missing an important finding or reading the same source repeatedly...

Read source
testmuai.com /1 month ago

AI Agent Tracing: Spans, Tool Calls and OpenTelemetry

AI agent tracing explained: what an agent trace is made of, how OpenTelemetry names its spans, how context crosses MCP, and where a trace stops being evidence.

Read source
dev.37signals.com /1 month ago

Parsing JSON-structured Docker logs with the OpenTelemetry Collector

Originally appeared on 37signals Dev.We deploy our Rails apps with Kamal, which runs them as Docker containers. Alongside the Prometheus metrics collection we set up earlier, we ru...

Read source
dzone.com /1 week ago

Microsoft Foundry Agent Debugging Dashboard with Microsoft Fabric Eventhouse, KQL, Docker and Grafana

An agent built in Microsoft Foundry makes many decisions in a single run. It calls a model, selects a tool, reads the tool result, and calls the model again. When the answer is slo...

Read source
infoq.com /1 week ago

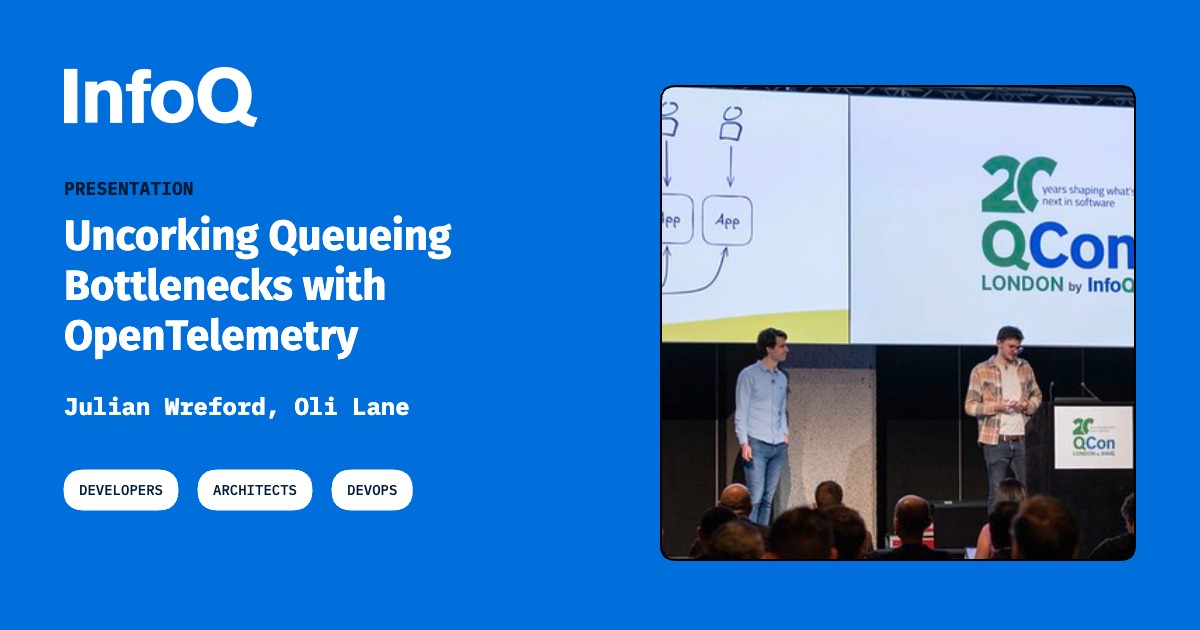
Presentation: Uncorking Queueing Bottlenecks with OpenTelemetry

Oli Lane and Julian Wreford share how Gearset replaced guesswork in distributed asynchronous queues with OpenTelemetry tracing. They explain why traditional metrics fall short, how...

Read source
dzone.com /1 month ago

The Telemetry Tax: Architecting Zero-Allocation Event Observability at 15B+ Daily Event Scale

Throughout my career, observability and monitoring systems have played a very important role in system stability, availability, and scalability when architecting, whether a system...

Read source
cncf.io /1 month ago

From 40 seconds to under 10: rebuilding incident detection on OpenTelemetry, Apache Kafka, and Apache Flink on Kubernete...

Every SaaS company has the same uncomfortable question after a major incident: who noticed first, the monitoring or the customers? For a long time our honest answer was “it depends...

Read source
testmuai.com /1 month ago

11 Best AI Observability Tools in 2026: LLM Tracing Compared

Compare 11 AI observability tools for LLM tracing and monitoring in 2026: tracing model, OpenTelemetry support, self-hosting, and which tools changed owners.

Read source
aws.amazon.com /2 days ago

Monitor Valkey clusters with OpenTelemetry metrics in Amazon ElastiCache

Amazon ElastiCache for Valkey now offers OpenTelemetry metrics, detailed monitoring, ElastiCache Insights, and PromQL. This post walks through one troubleshooting path: turn on det...

Read source
cncf.io /1 month ago

Carbon as a first-class signal: Bringing software carbon intensity to OpenTelemetry

At Observability Summit Europe 2026 in Prague, I presented a keynote titled Carbon as a First-Class Signal: Designing a Standard for OpenTelemetry. The talk explored how Software C...

Read source
dzone.com /3 weeks ago

AI-Native Observability Patterns and Anti-Patterns

AI-native observability requires teams to make both production systems and AI-driven workflows explainable through connected, verifiable telemetry. This Refcard explores patterns f...

Read source
snowflake.com /1 month ago

Why Observability Needs a Context Graph

See how Observe by Snowflake's Context Graph turns raw telemetry into linked datasets, so engineers and AI agents can trace why incidents happen, not just what happened.

Read source
infoq.com /3 weeks ago

Presentation: Wrangling Telemetry at Scale: A Guide to Self-Hosted Observability

Colin Douch shares battle-tested strategies for building and scaling self-hosted observability stacks. He explains how to effectively correlate metrics, structured logs, and distri...

Read source
dzone.com /4 weeks ago

Beyond the Wall of Charts: How Advanced Observability Displaced the Telemetry Dashboard

For the past decade, the gold standard of Site Reliability Engineering (SRE) was "all your telemetry in one place, beautifully rendered." Centralized platforms allowed teams to bui...

Read source
dzone.com /1 month ago

Part 3: End-to-End Tracing and Observability Across Goose, agentgateway, and Quarkus

Enterprise context — Acme FinServ. SOC 2 CC7 (system monitoring) requires that Acme can detect and investigate anomalous activity. When an agent-driven workflow touches customer da...

Read source
dev.to /3 weeks ago

What Claude Code's telemetry sends, and how to see it for yourself

This article was prepared with AI assistance, using ccdeck’s source code and documentation to check the technical details. I build ccdeck, whose Telemetry Radar is one of the way...

Read source

Turn fresh research into a full content calendar

Use SocialBu to discover ideas, generate post drafts, and schedule them across your social channels.