Latest updates for Infographic

Fresh curated links around infographic are collected here so marketers can spot useful updates and turn timely ideas into posts faster.

Recent items include:

  • ImagineLab Art Infographic Lab vs Napkin AI: Turning the Same Text Brief into a Visual
  • Cool Stuff Shown in Visuals Because F Reading
  • What Does 1.2ms Look Like [Infographic]

Post angles to try

Share the most useful takeaway for your audience.
Turn one article into a quick practical checklist.
Ask your audience how this shift affects their work.
Turn angles into scheduled posts

Fresh articles and ideas

Recent curated links from global sources. Generate one free draft from any story, then use SocialBu to schedule and refine your content calendar.

editorialge.com /3 weeks ago

ImagineLab Art Infographic Lab vs Napkin AI: Turning the Same Text Brief into a Visual

An infographic has to earn its place beside an article. When I turn written material into a visual, I want readers to grasp it quickly, and I need enough control to make the result...
Read source
thechive.com /1 month ago

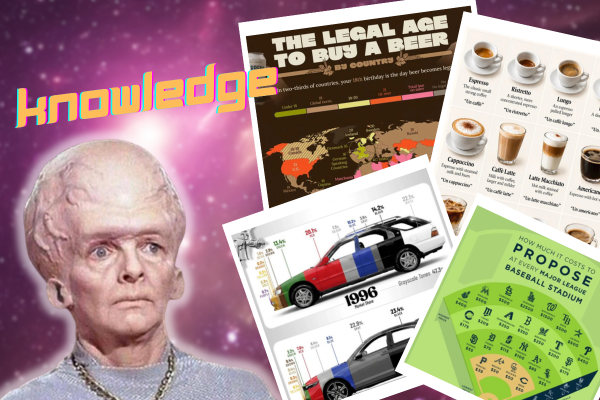
Cool Stuff Shown in Visuals Because F Reading

Read source
best-infographics.com /2 weeks ago

What Does 1.2ms Look Like [Infographic]

Time goes faster than some of us can even image. A lot can happen in just 1ms. This infographic serves as an example of what happens in 1.2ms, which is the amount of time it takes...

Read source
dramarnathgiri.blogspot.com /3 weeks ago

This infographic is a perfect summary for a toolbox talk, management presentation, or LinkedIn post. Here's how to expla...

 This infographic is a perfect summary for a toolbox talk, management presentation, or LinkedIn post. Here's how to explain it section by section:The Big IdeaTitle: Why ISO 45001 C...

Read source
fastcompany.com /3 weeks ago

MoMA explores the useful beauty of information design

When people post infographics on their Instagram accounts, they’re sharing information and facts about the world with their followers. They’re also trying to convey something about...

Read source
kienthuc.net.vn /1 month ago

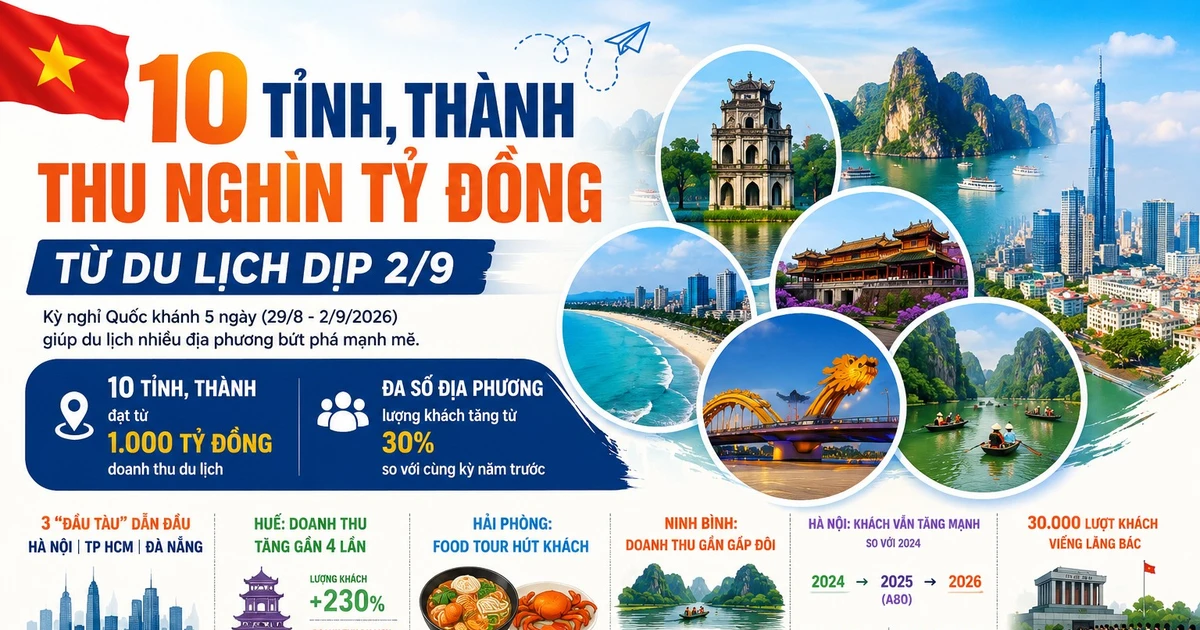
[INFOGRAPHIC] 10 tỉnh, thành thu nghìn tỷ đồng từ du lịch dịp 2/9

Kỳ nghỉ Quốc khánh 5 ngày giúp nhiá»u Ä‘iểm đến bứt phá, trong đó 10 tỉnh, thành ghi nhận doanh thu du lịch từ 1.000 tá»· đồng trở lên.[INFOGRAPHI...

Read source
amrc.org.uk /1 month ago

2025: Our sector's footprint

Published: June 2025 This infographic outlines key facts and figures about our members and the research they fund. To facilitate the sharing of these stats, you can view and downl...

Read source
brafton.com /3 weeks ago

How To Optimize for AI Overviews & Increase Your Brand Visibility on Google (Infographic)

AI Overviews dominate SERPs. Here’s how to optimize for AI overviews so your content gets served to customers in generative search answers. The post How To Optimize for AI Overview...

Read source
kevinmd.com /1 month ago

Medical infographics now look right without being right

I recently found myself doing something almost every medical student has done before a presentation: searching online for a diagram that could explain a complex concept more clearl...

Read source
police1.com /3 weeks ago

3 asset management trends shaping the future of law enforcement operations (infographic)

Download this infographic from Collective Data to learn about strengthening audits, accountability and workflows before your next inspection or review.

Read source
everlaw.com /1 month ago

Efficiently Manage Complex Data Sets with Data Visualization

Efficiently Manage Complex Data Sets with Data Visualization by Giulianno Lopez

Read source
brafton.com /1 month ago

Website Marketing: The Definitive Guide (Infographic)

Properly managed, a website marketing strategy can help your business attract new customers and ultimately expand your business’s share of the market. The post Website Marketing: T...

Read source
jotform.com /1 week ago

6 best AI data visualization tools in {! YEAR !}

You could write at length about last quarter’s sales, the economy of Ecuador, the adoption of alternative energy sources, or any other large data set. No single stat or trend, thou...

Read source
kienthuc.net.vn /1 month ago

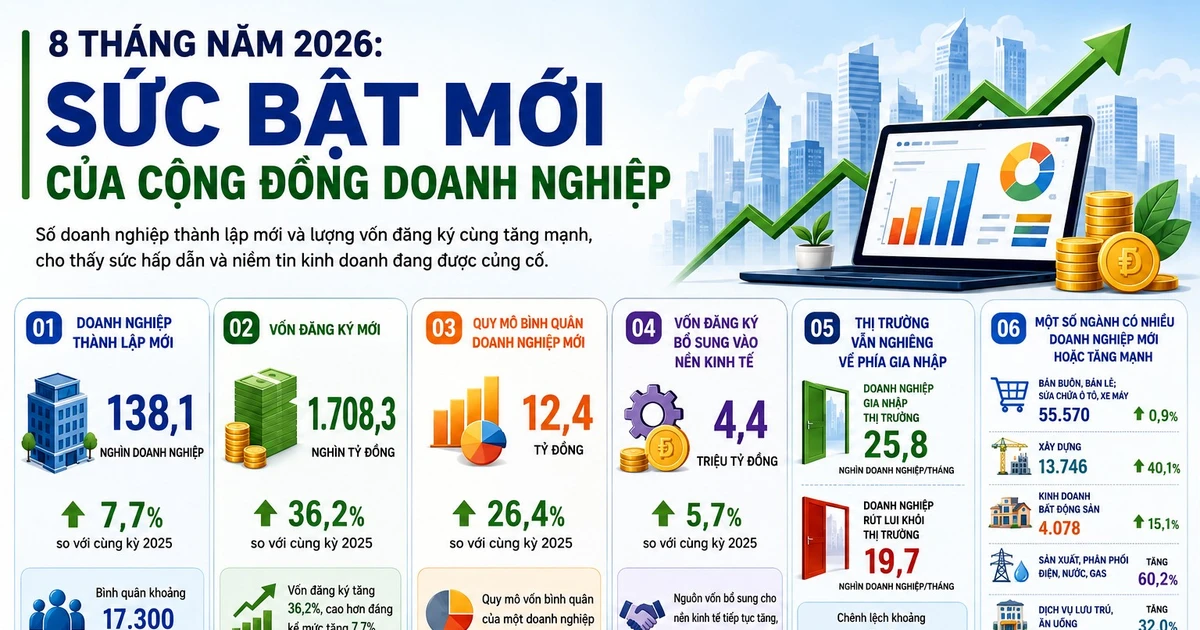
[INFOGRAPHIC] 8 tháng năm 2026: Sức bật mới của cộng đồng doanh nghiệp

8 tháng năm 2026, số doanh nghiệp thành lập má»›i và lượng vốn đăng ký cùng tăng mạnh, cho thấy sức hấp dẫn và niá»m tin kinh doanh Ä‘ang được cá...

Read source
everlaw.com /1 month ago

5 Ways to Deliver Greater Value through Data Visualization

5 Ways to Deliver Greater Value through Data Visualizationby Giulianno Lopez...

Read source
brafton.com /1 month ago

White Paper vs. eBook: What’s the Difference? (Infographic)

Ah, the great white paper vs. eBook debate. Today, we’ll introduce you to both and see which is right for your content marketing strategy needs. The post White Paper vs. eBook: Wha...

Read source
flowingdata.com /4 weeks ago

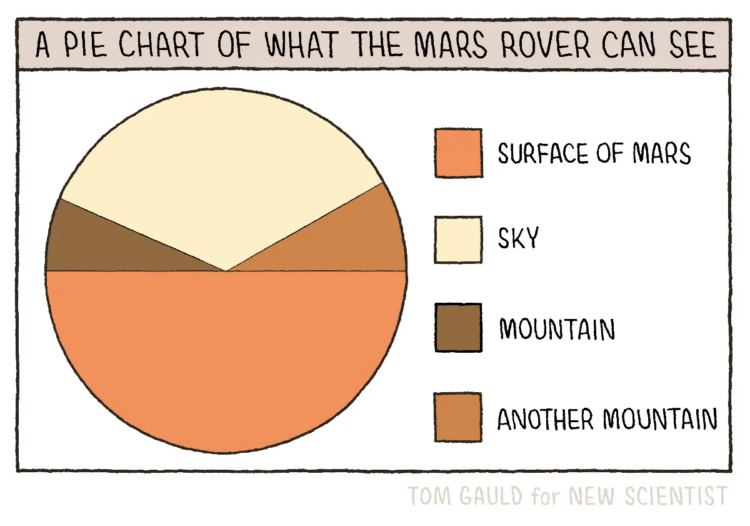
Pie chart of what the Mars rover can see

New to me, Tom Gauld, for New Scientist, made a fine pie chart…Tags: comic, humor, Mars, New Scientist, Tom Gauld

Read source
awwwards.com /1 month ago

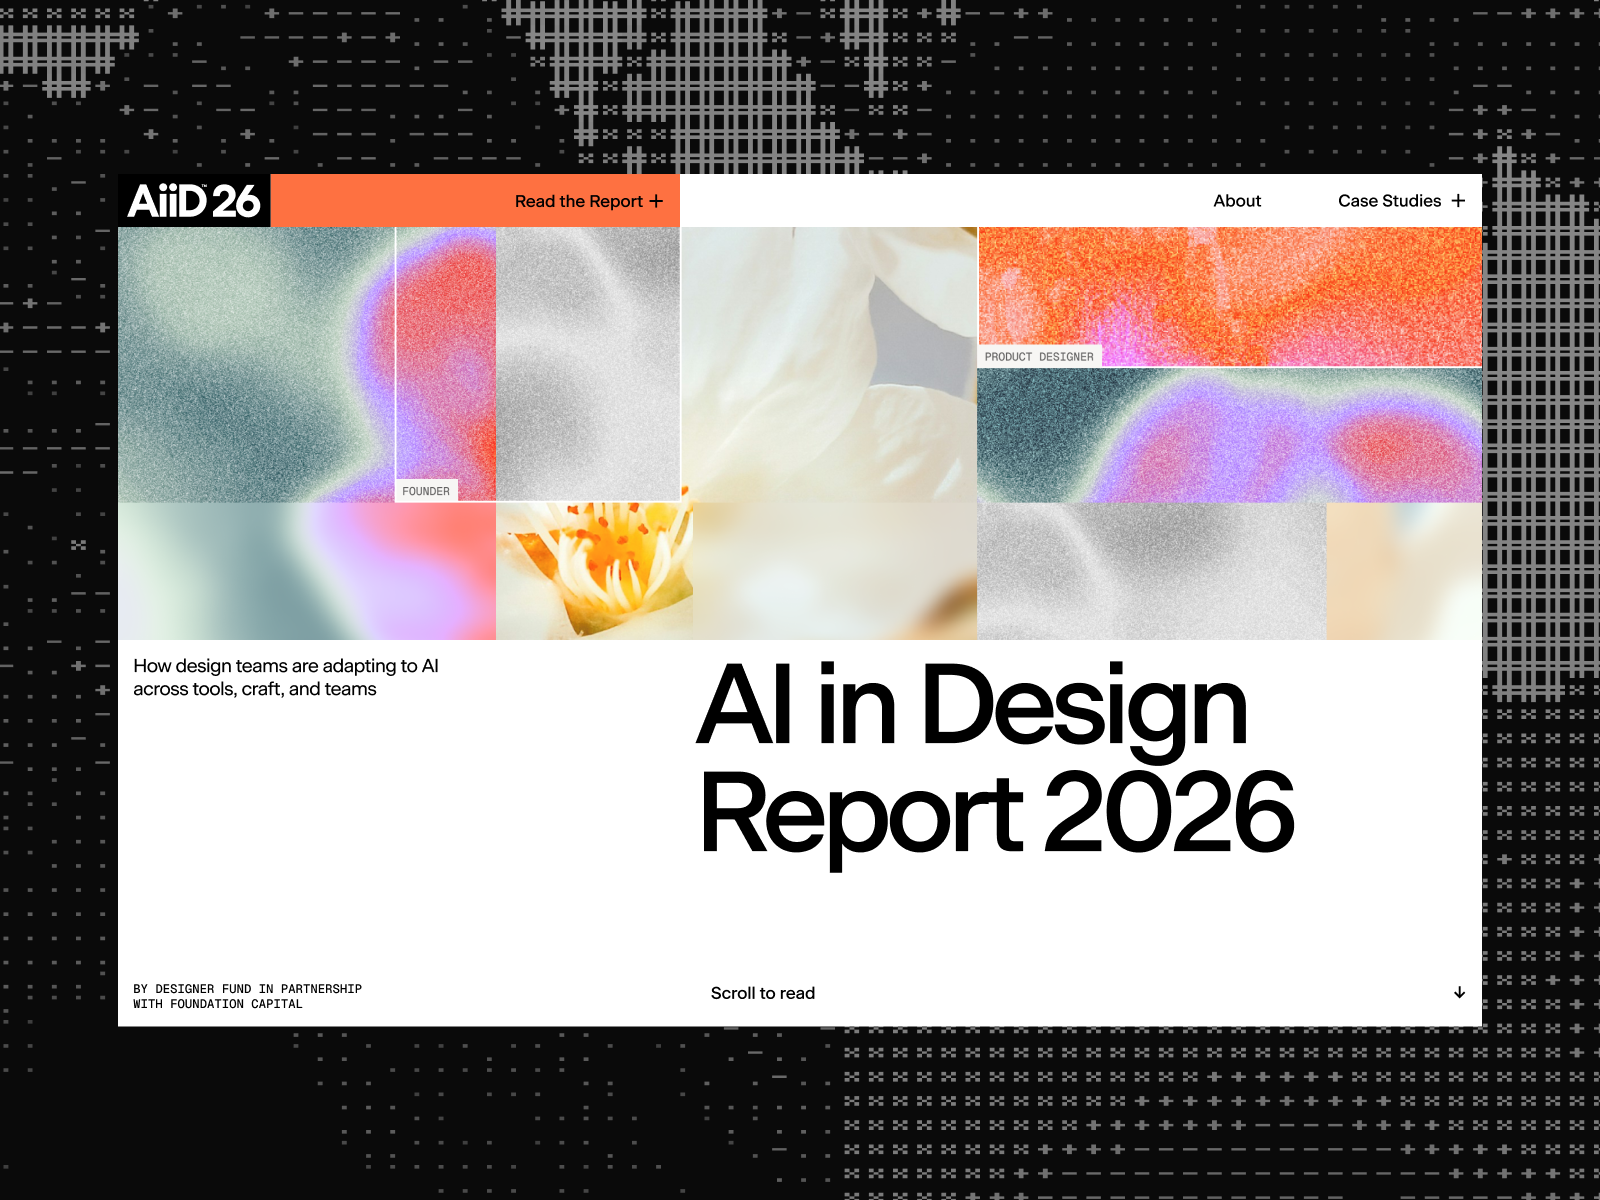
Ai in Design Report 2026

A research report transformed into an editorial digital experience, where data, analysis, and motion speak in a single visual language.

Read source
best-infographics.com /1 month ago

12 Cognitive Biases Visualized [Infographic]

A lot of us have biases that we may not even be aware of. We have all heard about the sunk cost fallacy, Dunning Kruger effect and recency bias. This infographic from Gadgetify vis...

Read source
brafton.com /3 weeks ago

8 Types of Podcasts: The Complete Guide to Audio Content Marketing (Infographic)

Explore the role of podcasts in engaging new segments and why they're a powerful tool in today's content landscape. The post 8 Types of Podcasts: The Complete Guide to Audio Conten...

Read source
flowingdata.com /2 weeks ago

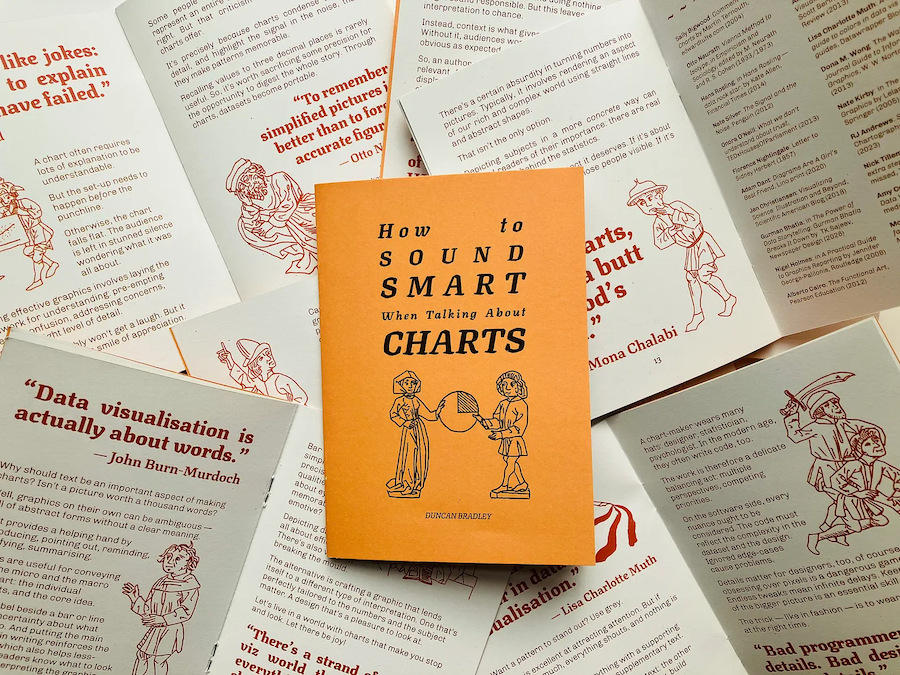
Sound smart about charts

Duncan Bradley made a zine of one-liners from data visualization folks. It is…Tags: Duncan Bradley, guide

Read source
uxdesign.cc /1 month ago

A short history of logos made of data

An idea kept coming back in most branding projects I worked on in the past years: what if we embedded data in the logo? Real data, not symbols of information but information itself...

Read source
lifesitenews.com /1 month ago

Thumbnail Graphic

thumbnail_graphic

Read source
best-infographics.com /1 month ago

What Happens Every 60 Seconds on the Internet

People are making more content than ever on the internet these days. We also have plenty of prompts submitted as LLMs become more popular. This infographic from Gadgetify takes a l...

Read source

Turn fresh research into a full content calendar

Use SocialBu to discover ideas, generate post drafts, and schedule them across your social channels.

Sources covering Infographic

dramarnathgiri.blogspot.com

Recent coverage from public sources
Public source

editorialge.com

Recent coverage from public sources
Public source

feeds.feedburner.com

Recent coverage from public sources
Public source

flowingdata.com

Recent coverage from public sources
Public source

kienthuc.net.vn

Recent coverage from public sources
Public source

thechive.com

Recent coverage from public sources
Public source