flowingdata.com /2 weeks ago

Data exploration, manually and intentionally

Randy Au on the manual process of exploratory data analysis that is still…Tags: automation, Large Language Model, Randy Au

Read source
flowingdata.com /1 month ago

вњљ Getting to know a dataset

This week, I walk through my own thinking as I poke at fresh data.Tags: analysis

Read source
towardsdatascience.com /1 month ago

How Many Stories Can Your Data Tell?

How the way we represent data can change what we think the data is saying The post How Many Stories Can Your Data Tell? appeared first on Towards Data Science.

Read source
kdnuggets.com /1 month ago

How to Use Marimo for Interactive Data Analysis

Learn how to use Marimo for interactive data analysis with Python, Pandas, and Altair, and turn a reactive notebook into a simple shareable dashboard.

Read source
statmodeling.stat.columbia.edu /1 month ago

Survey Statistics: 2 different uses of simulated data

Last month Andrew wrote: I use simulated data to understand how a model works; it can be viewed as a form of mathematical analysis, a way of working out the implications of a set o...

Read source
blog.devgenius.io /1 week ago

Seven Charts, One Call: Model Evaluation in CanvasXpress

ROC, precision-recall, confusion matrix, calibration, learning curves, feature importance and SHAP — built straight from a classifier’s…Continue reading on Dev Genius »

Read source
robjhyndman.com /4 weeks ago

Surprises in time series analysis

Part of Time Series Connect webinar series Monday 26 October 2026, 6:00 PM Eastern Time Abstract I will present a statistical framework for identifying anomalies in three time ser...

Read source
jotform.com /4 weeks ago

Survey data analysis methods: A {! YEAR !} how-to guide

Survey data analysis turns raw responses into decisions: It cleans your data, summarizes key figures, compares trends and groups, scans open-text answers, and generates insight int...

Read source
habr.com /1 month ago

Описательный анализ и где он обитает

Просто стало интересно - что такое описательный анализ. Математический анализ, функциональный анализ знаю. А описательный?Наверно такое определение подойдет: Описательный анализ -...

Read source
medium.com /4 days ago

How Do I Analyse Questionnaire Data in Excel for My Project?

Excel can handle entering and cleaning data, counts, percentages, means, standard deviations, frequency tables and charts, plus some tests…Continue reading on Medium »

Read source
medium.com /1 month ago

Why t-Digest (Asymmetric Quantile Sketching) in SQL Is Powerful Than You Think (And How to Master…

t-Digest quantile sketching to efficiently analyze distributions and estimate percentiles at scaleContinue reading on Medium »

Read source
r-bloggers.com /1 week ago

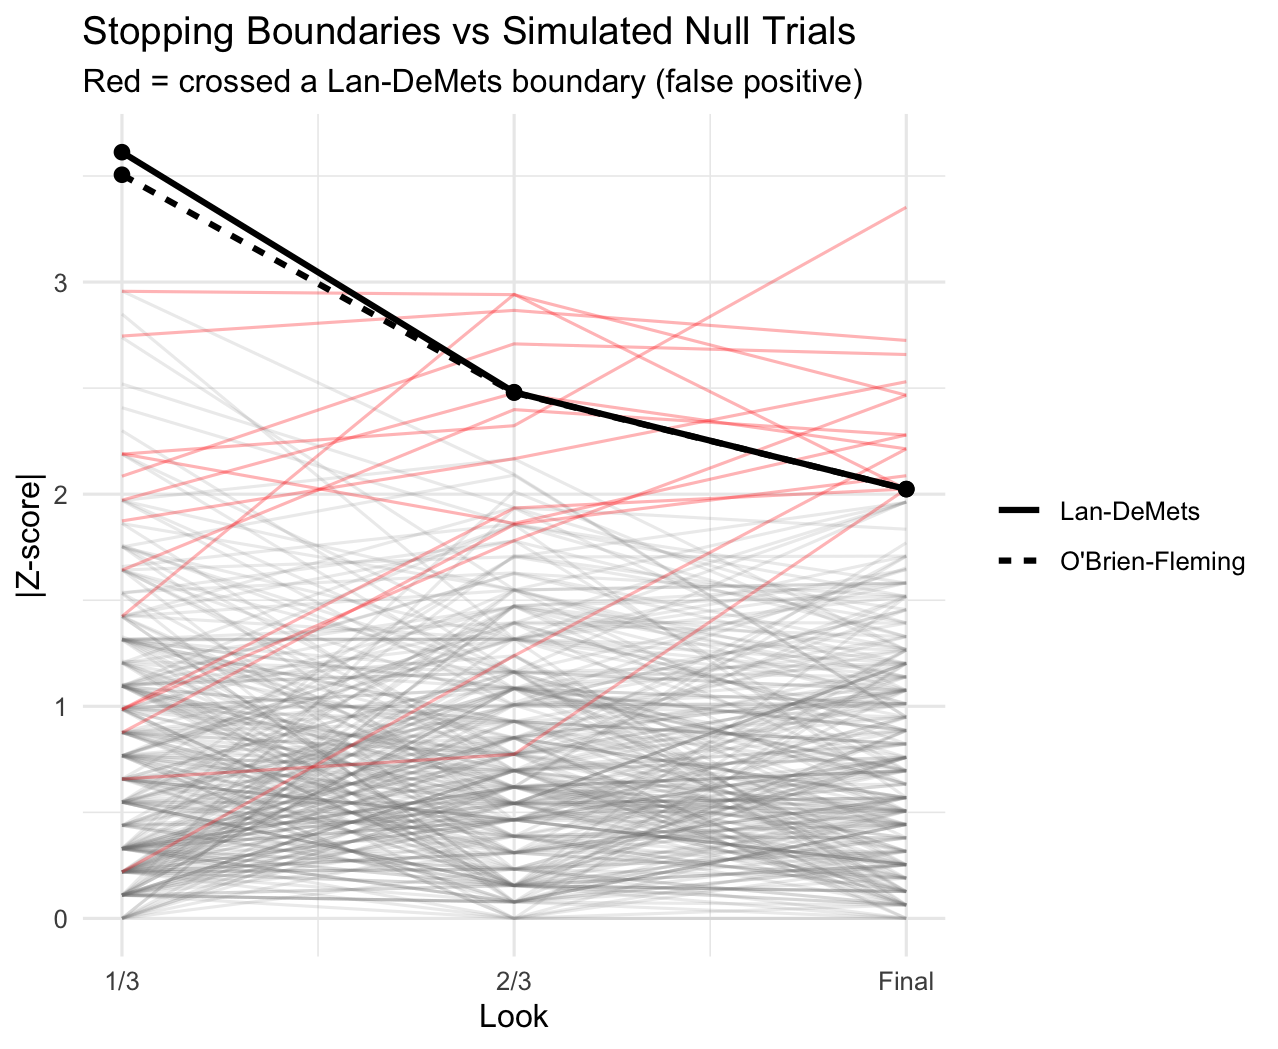
Interim Analysis: My Messy Notes

Why can’t we just peek at our data with α = 0.05 every time? 🤔 Gotta see it to believe it! Simulating the inflated error, seeing why it’s not Bonferroni, and rebuilding O’Brien-Fl...

Read source
towardsdatascience.com /4 weeks ago

Skewness and Kurtosis: From Moments to Machine Learning

The mathematics, intuition, interpretation, and practical use of higher-order moments. The post Skewness and Kurtosis: From Moments to Machine Learning appeared first on Towards Da...

Read source
r-bloggers.com /1 week ago

Preparing the Data: Cattell’s 16 Factor Personality Measure

As I said in my previous post, I'm working on a 2-part series where I show how to conduct psychometric analysis on a personality measure. Those posts are coming very soon, but toda...

Read source
r-bloggers.com /1 month ago

A Trip from Covariance to Correlation and Back

When we have a multi-trait table of data, we might be interested in investigating variability structure and the reciprocal relationships (whether causal or non-causal) among variab...

Read source
medium.com /1 month ago

The Hidden Tax of Ad Hoc Data Analysis: Why Improvising Investigations Bleeds Your Budget

Continue reading on Medium »

Read source
r-bloggers.com /21 hours ago

Classical Test Theory Analysis of the 16 Factor Personality Measure

In my last post, I talked through how to clean the dataset of careless responders, responders with too much missing data, and people older than time itself. Today, I’ll go through...

Read source
r-bloggers.com /1 month ago

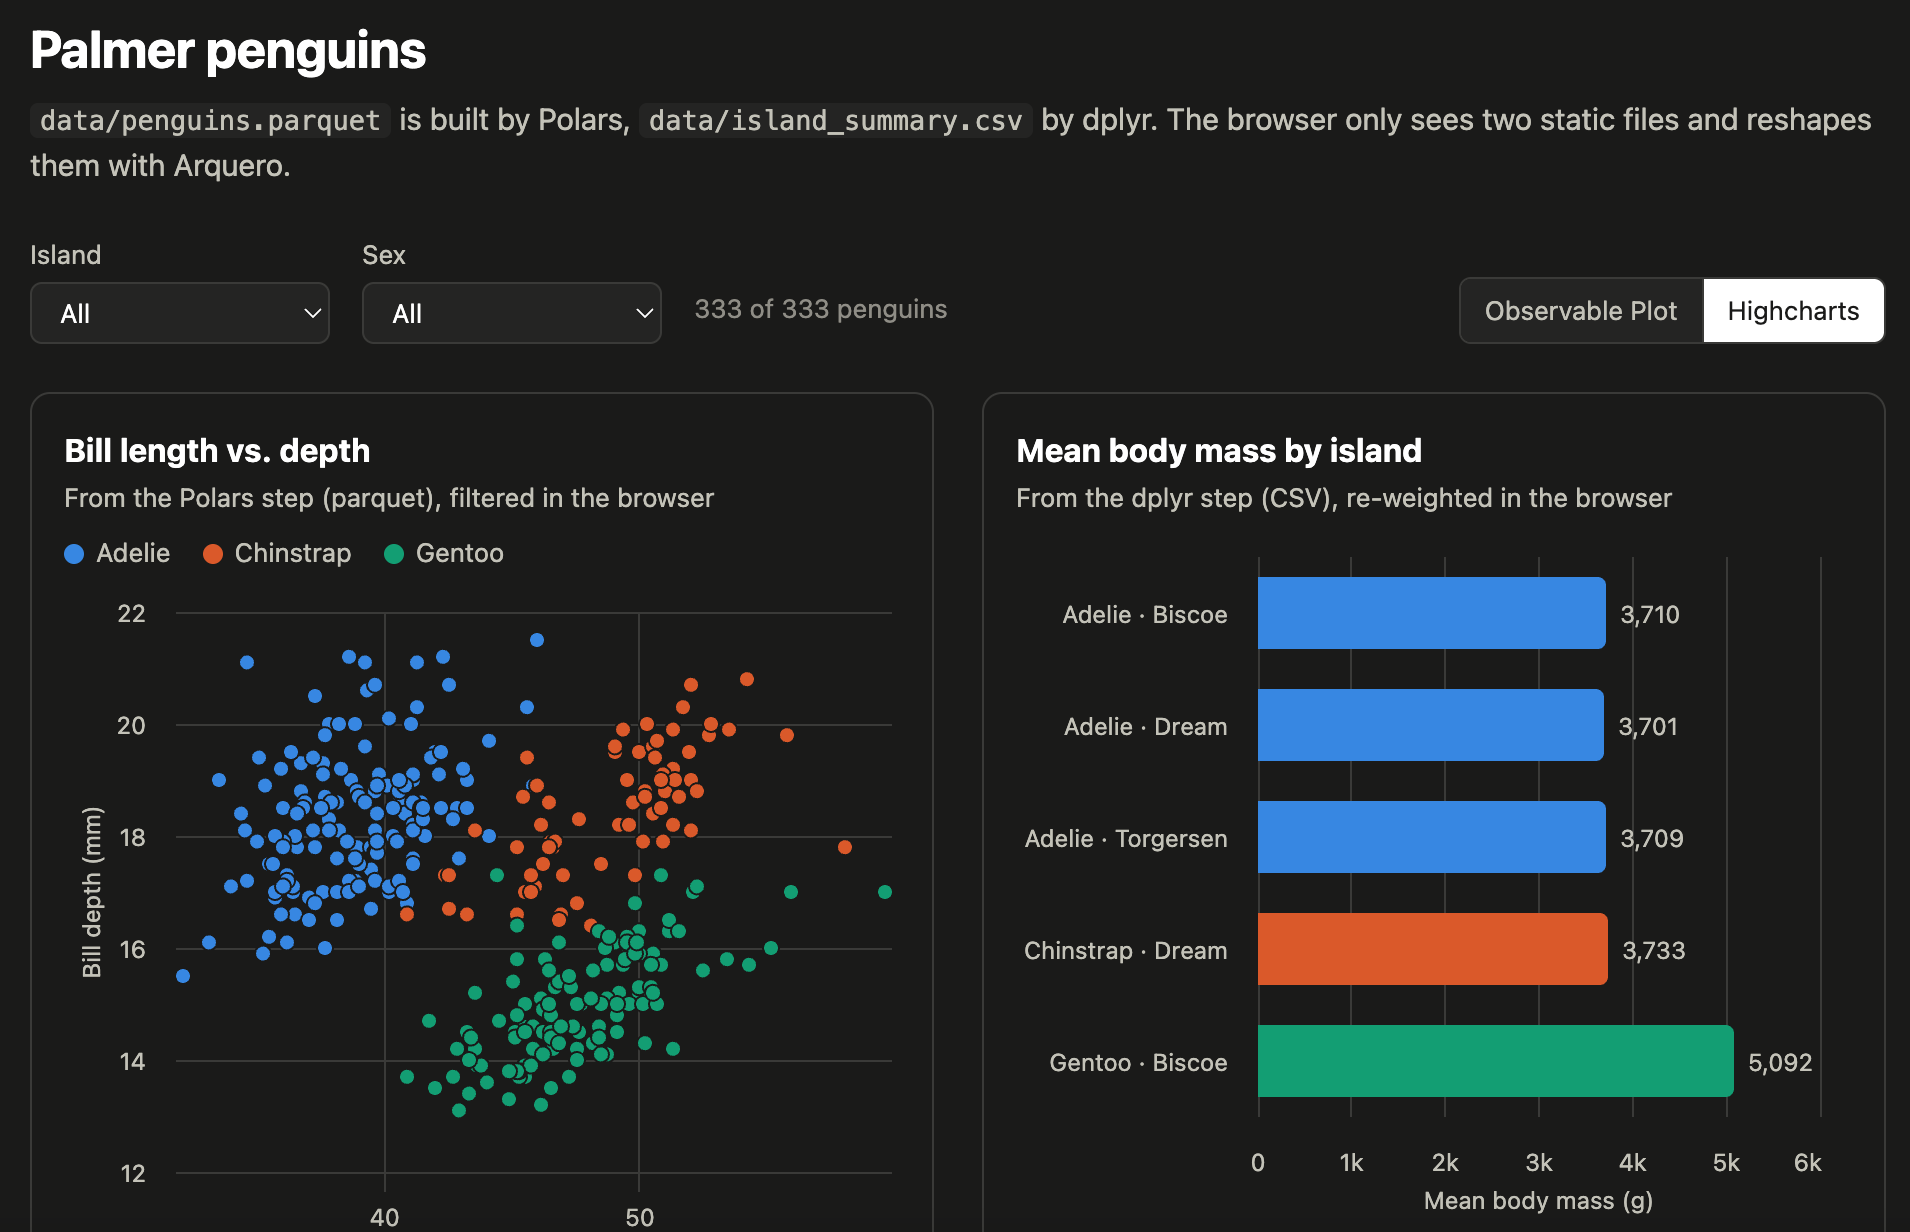
Analytics Pipeline for Dashboards, with Python, R and Javascript

I had a lot of fun this morning, brainstorming and assembling this _Analytics Pipeline_ for Dashboards with Claude (and yes it takes much, much more than only 10 prompts). Contin...

Read source
jotform.com /1 month ago

8 best automated data analysis tools in {! YEAR !}

Automated data analysis tools keep teams efficient. AI keeps tabs on the mundane, such as cleaning data, summarizing patterns, generating charts, creating reports, answering questi...

Read source
simplilearn.com /1 month ago

Top Data Science Tools | Simplilearn

Every facet of our existence—our identities, financial details, professional activities, and entertainment choices—has transitioned to a digital format, leaving paper and physical...

Read source
towardsdatascience.com /1 month ago

Both Charts Are Right. So Why Do They Disagree?

The statistical paradox that shows how combining data can reverse the story. The post Both Charts Are Right. So Why Do They Disagree? appeared first on Towards Data Science.

Read source
dev.to /2 weeks ago

Where should a small studio launch its next Android app? A data experiment on 9,644 Google Play apps

A market report for My MobApp Studio, written up as a scientific experiment. Code: Jupyter notebook my_mobapp_studio.ipynb. 1. The question Our studio has decided to bu...

Read source
towardsdatascience.com /4 weeks ago

Don’t Let Messy Data Bend Your Curves

Robust Estimation Series: Building Accurate Curves with Polynomials and Splines With Spurious Data The post Don’t Let Messy Data Bend Your Curves appeared first on Towards Data Sci...

Read source
kdnuggets.com /1 month ago

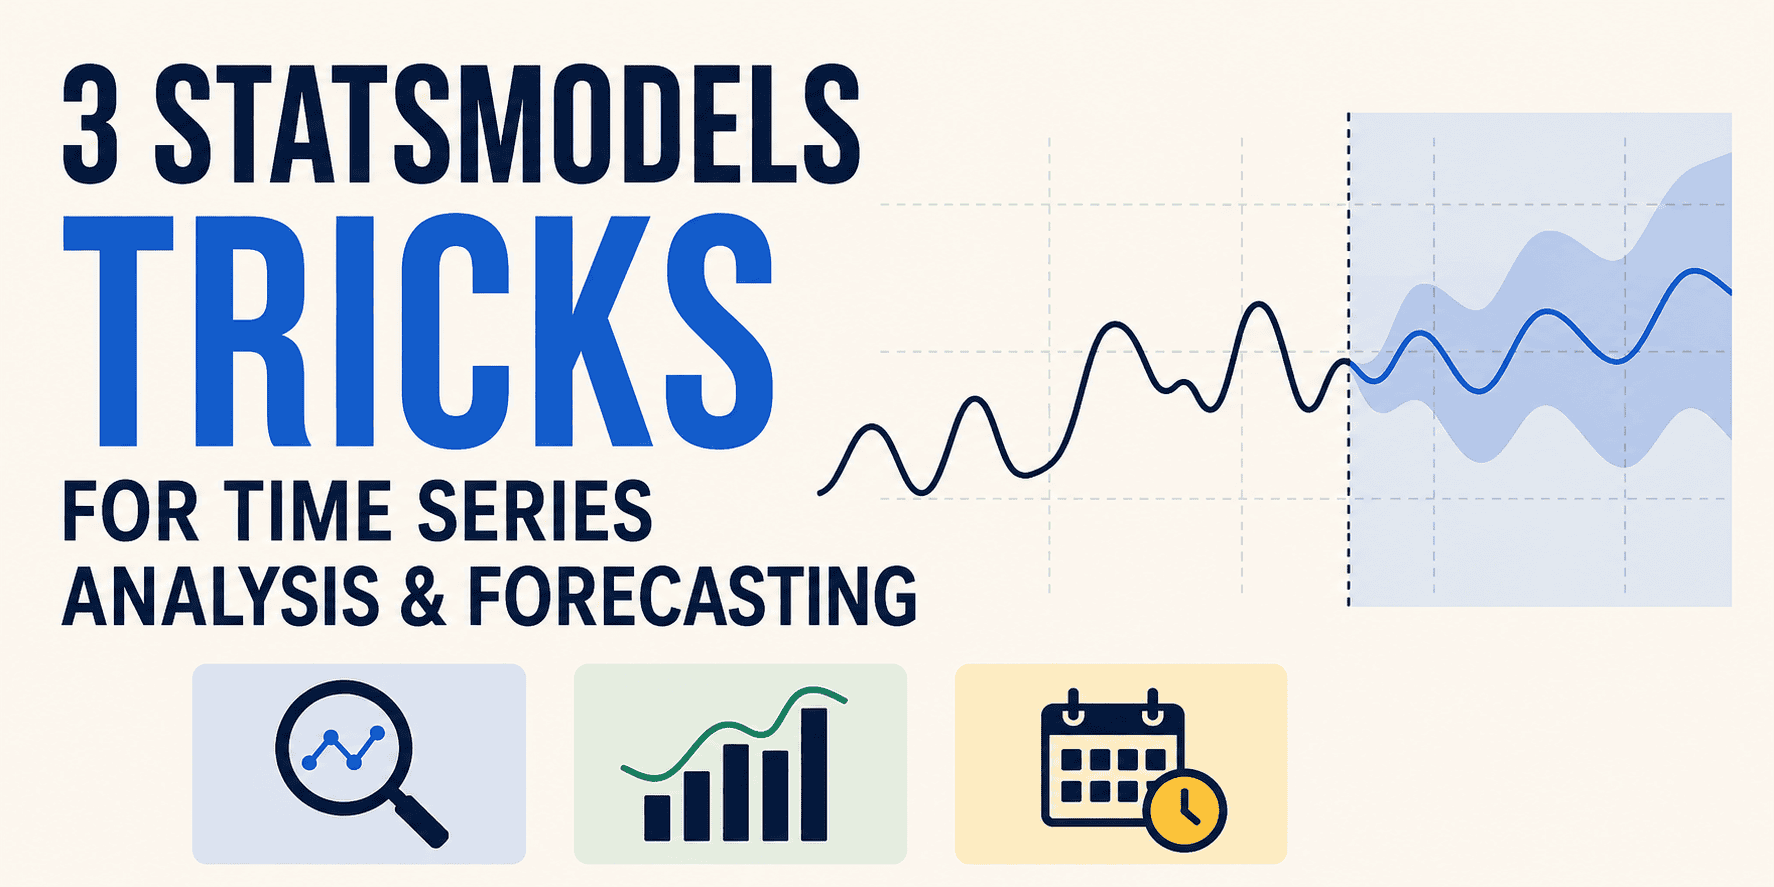
3 Statsmodels Tricks for Time Series Analysis & Forecasting

A fitted statsmodels model computes a more than just the array of numbers most code pulls out of it.

Read source

Turn fresh research into a full content calendar

Use SocialBu to discover ideas, generate post drafts, and schedule them across your social channels.