econbrowser.com /1 month ago

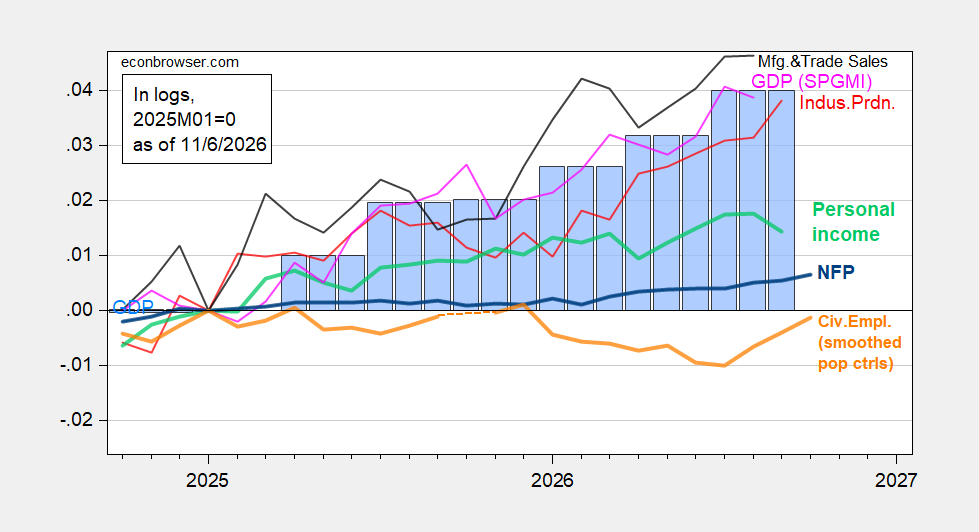
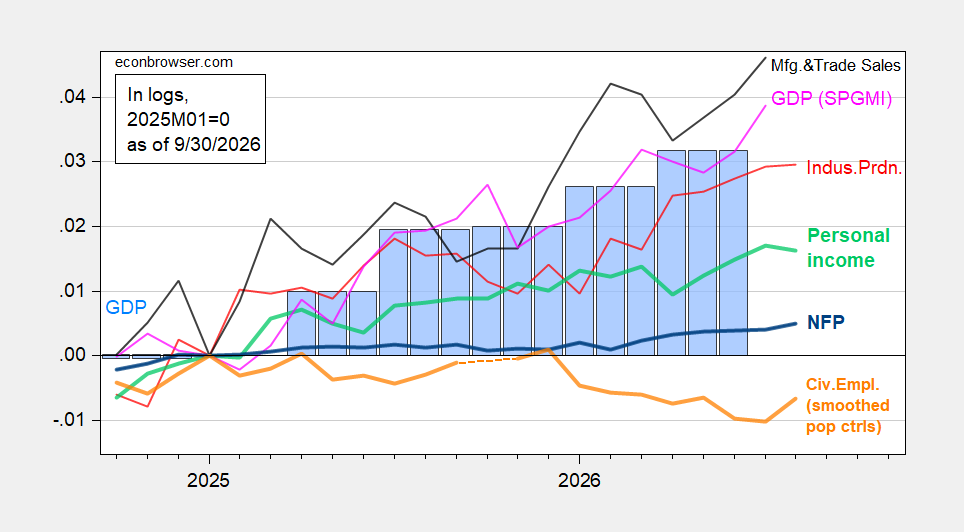
Business Cycle Indicators: Real GDP, Personal Income Trajectory Revised Up

Q2 GDP growth revised up 0.7 ppts, path of personal income ex-transfers up due to revised deflator. Here are the key indicators followed by the NBER’s Business Cycle Dating Committ...
Read source
econbrowser.com /1 month ago

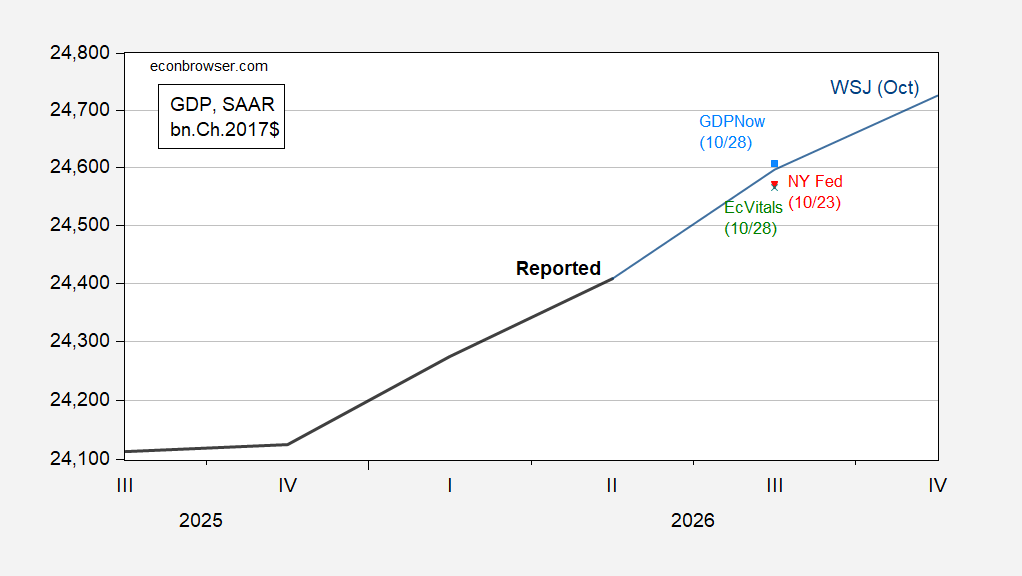
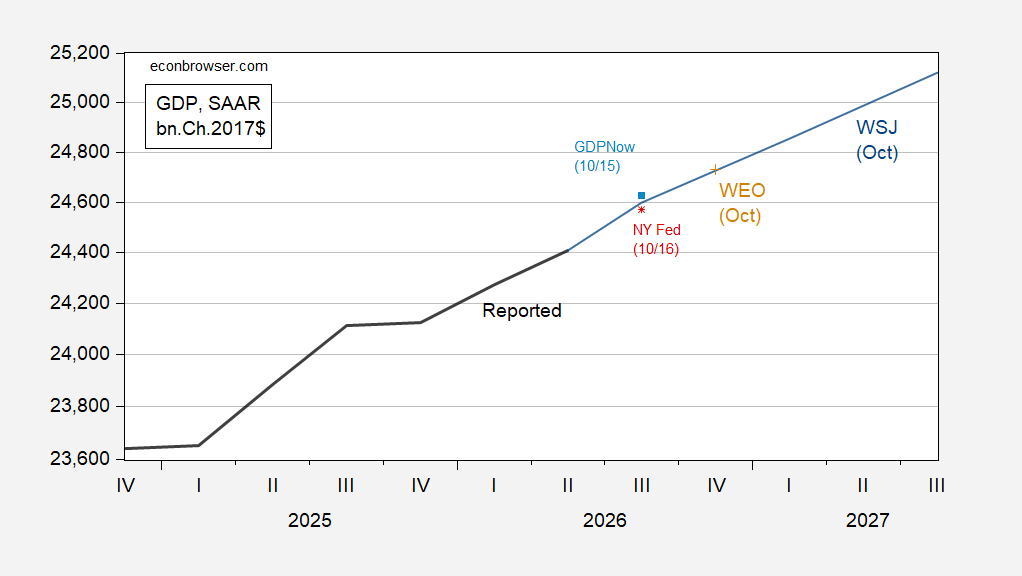
Nowcasts and WEO, WSJ Forecasts

Recent releases: Figure 1: Reported GDP (bold black), October WSJ mean forecast (blue), GDPNow (light blue square), NY Fed nowcast (red *), October WEO (tan +). Source: BEA 2026Q2...

Read source
econbrowser.com /1 week ago

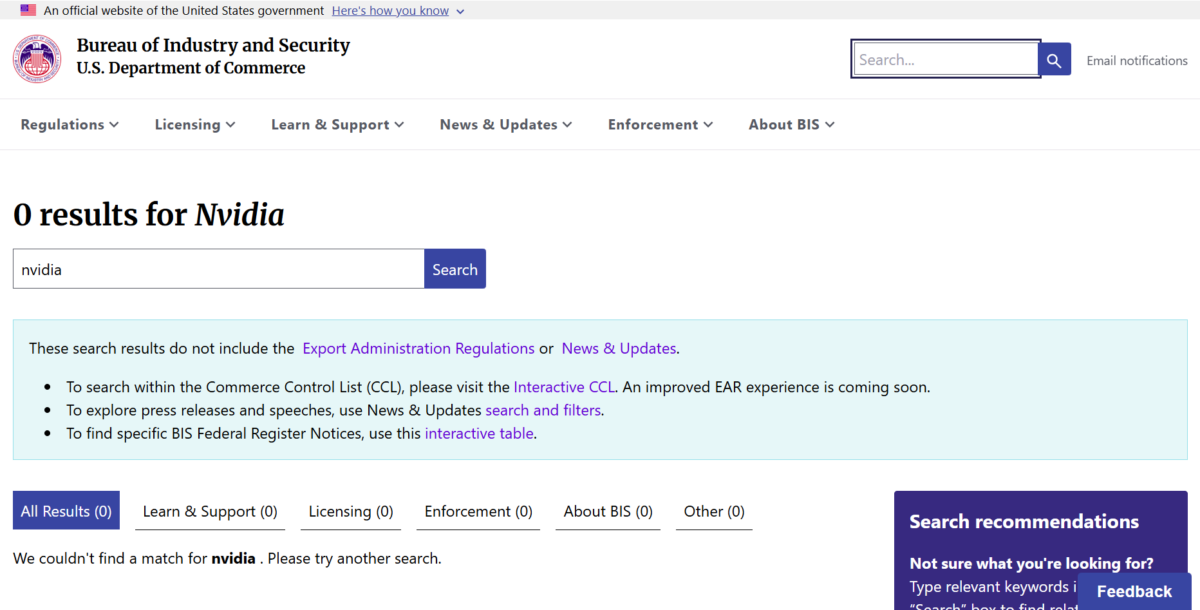
Commerce Bureau of Industry and Security Search Screenshot

If you were curious: Source: Commerce/BIS, accessed 11/12/2026, 1:45PM CST.

Read source
wichitaliberty.org /3 weeks ago

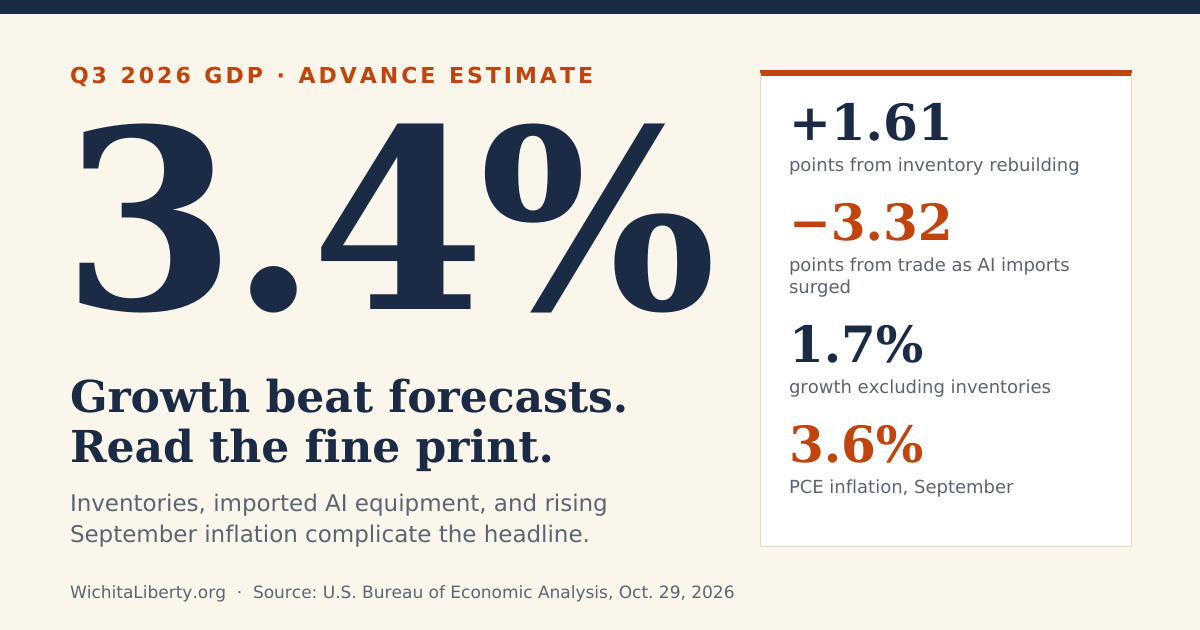
The Economy Grew 3.4% Last Quarter. Here’s What’s Underneath That Number.

The Q3 2026 GDP report beat forecasts with 3.4% growth, the fastest in a year. But inventories drove nearly half of it, AI equipment imports offset investment, and inflation rose i...

Read source
econbrowser.com /3 weeks ago

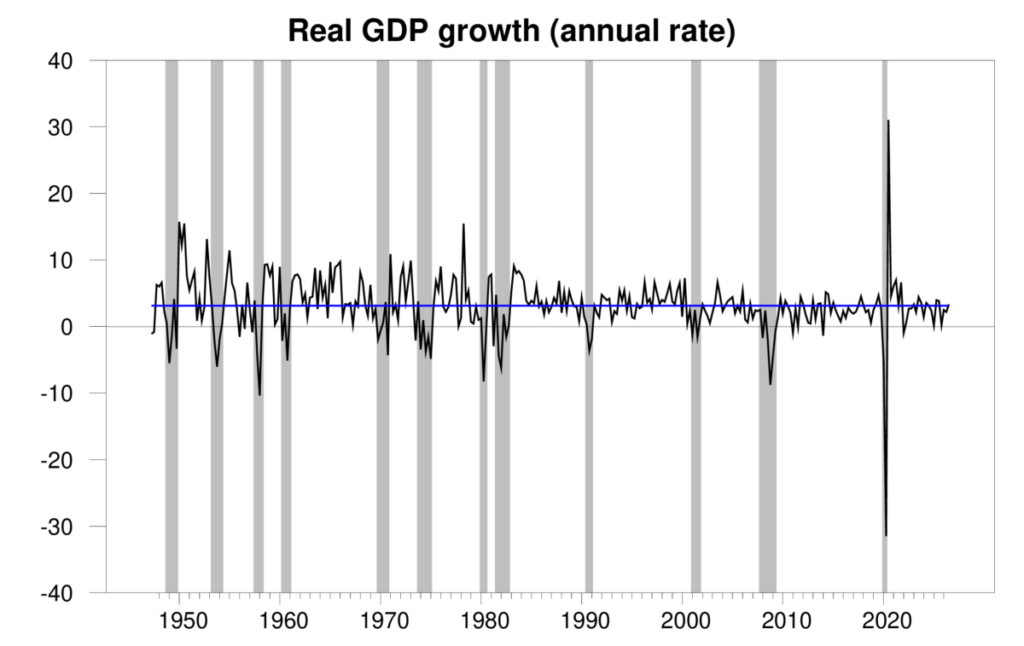
U.S. GDP grows more in Q3

The Bureau of Economic Analysis announced today that seasonally adjusted U.S. real GDP grew at a 3.4% annual rate in the third quarter. That is a little above the historical averag...

Read source
econbrowser.com /1 month ago

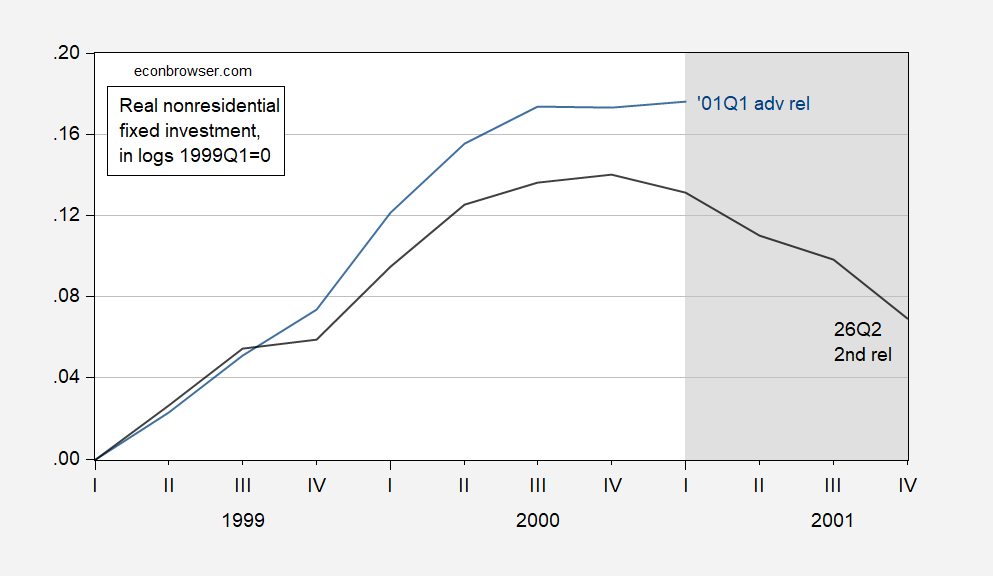
Nonresidential Fixed Investment in the DotCom Boom/Bust

What did we think was happening back then, compared to what we know now? Figure 1: Nonresidential fixed investment from 2001Q1 advance release (blue), from 2026Q2 2nd release (blac...

Read source
econbrowser.com /3 weeks ago

On the Eve of the 2026Q3 Advance GDP Release

GDP growth nowcasted as solid; nowcasted “core GDP” goes gangbusters. Advance release to be discussed by Jim tomorrow… Figure 1: GDP (bold black), GDPNow of 10/38 (light blue squar...

Read source
econbrowser.com /2 weeks ago

Business Cycle Indicators: Employment Grows

Key indicators followed by the NBER Business Cycle Dating Committee, as well as alternative indicators: Figure 1: NFP employment (bold blue), civilian employment with smoothed popu...

Read source
econbrowser.com /3 weeks ago

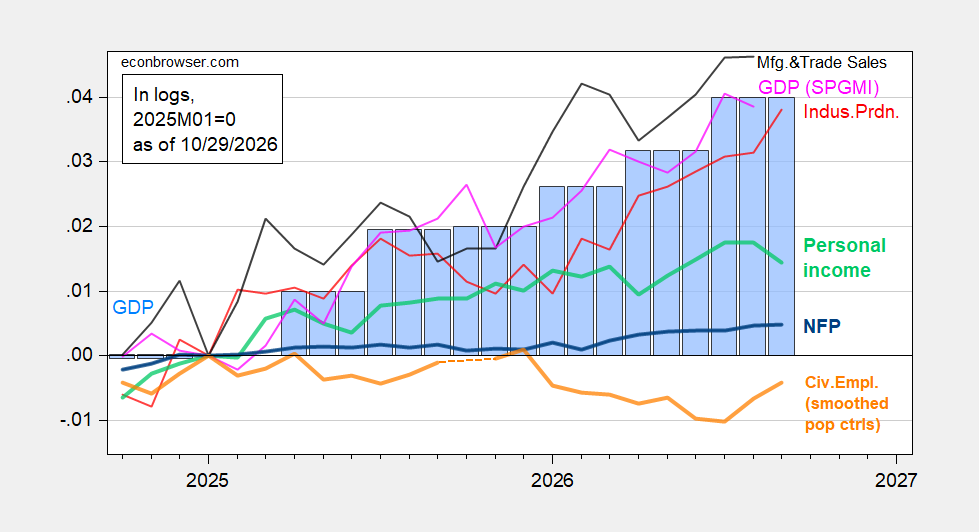
Business Cycle Indicators: GDP, Personal Income, Mfg & Trade Sales, Consumption

GDP is up as Jim discussed. Consumption flat, personal income ex-transfers down. Nominal consumption and income both below consensus by 0.1% m/m. Figure 1: NFP employment (bold blu...

Read source
econbrowser.com /1 month ago

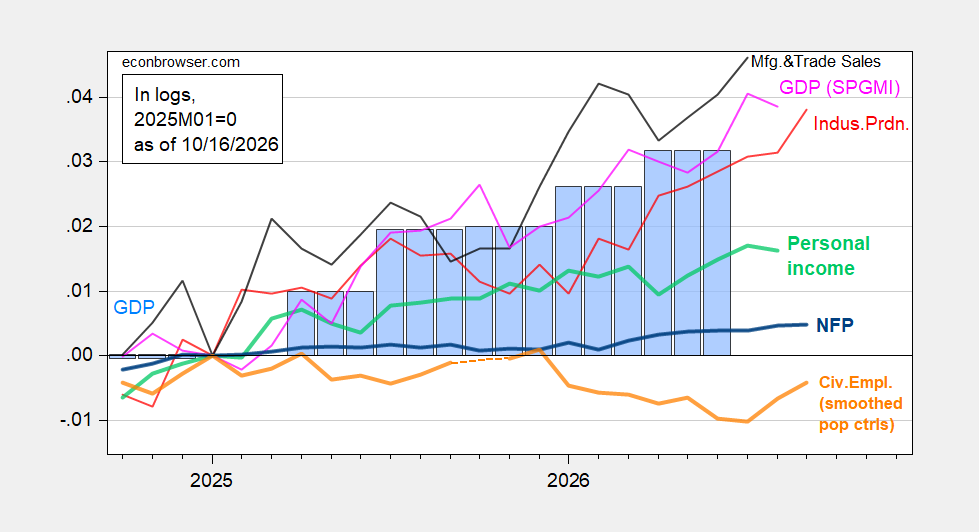
Business Cycle Indicators: Industrial Production Up, Retail Sales Flattish

and Monthly GDP for August, manufacturing production. First, NBER BCDC indicators: Figure 1: NFP employment (bold blue), civilian employment with smoothed population controls (bold...

Read source
investinglive.com /2 weeks ago

US September international trade balance -105.0B vs -108.0B expected

Prior was -$105.6 billionGoods trade balance -135.0B vs -$134.9 billion prelimUS-China balance -$21.87 vs -$18.4 priorExports $321.51 billion vs $315.67 billion priorImports of cap...

Read source
econbrowser.com /4 days ago

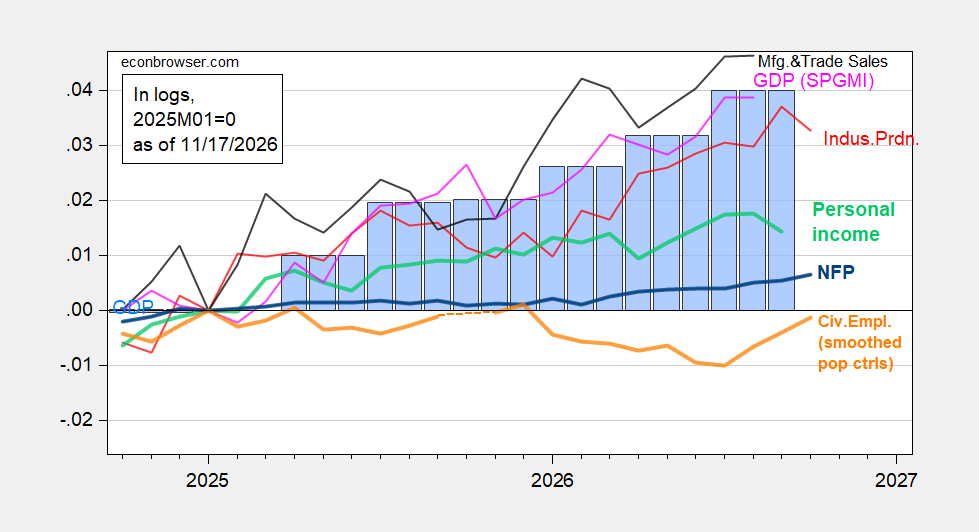
US Business Cycle Indicators: Industrial, Mfg. Production, Retail Sales

Nominal retail sales upside surprise (+0.2% vs consensus +0.1% m/m), but actual real declines. Manufacturing production +0.3% vs. consensus +0.2% m/m (industrial production down pr...

Read source
usnn.news /3 weeks ago

US Economy Gains Momentum as 3rd-Quarter GDP Grows Better-Than-Expected 3.4 Percent

By Andrew Moran The U.S. economy recorded its best quarter in a year as consumer spending and business investment lifted growth above expectations. Real GDP growth was 3.4 percent...

Read source
wbrz.com /3 weeks ago

Industry economic outlook remains positive as expectations rise

BATON ROUGE — The Industry Economic Outlook Index measured 65 on Monday, remaining above the expansion threshold of 50 despite a shifting workforce, geopolitical and econ...

Read source
econbrowser.com /3 weeks ago

PCE Inflation in September

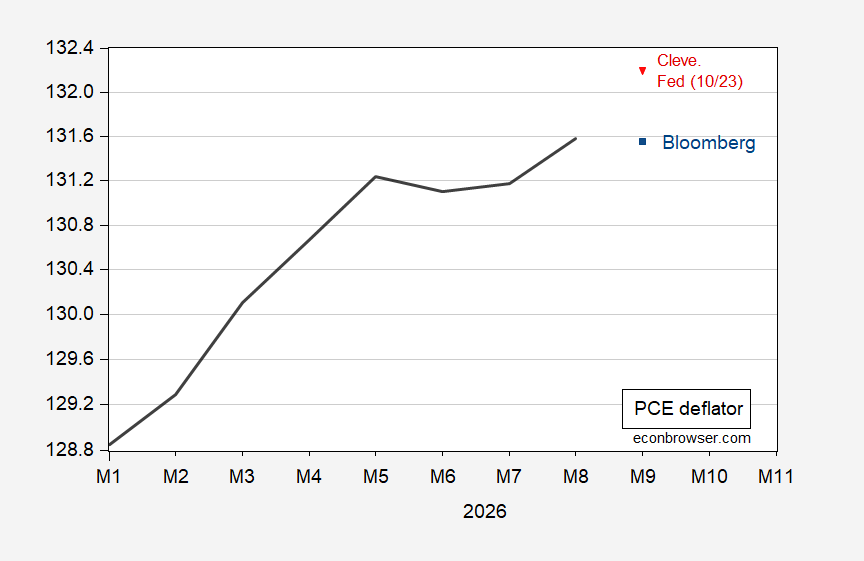
Some divergence from Cleveland Fed nowcast vs. Bloomberg consensus: Figure 1: PCE deflator (black), Cleveland Fed nowcast (red triangle), Bloomberg consensus on 10/25 (blue square)...

Read source
recruitingheadlines.com /1 week ago

BLS: Business Employment Dynamics—First Quarter 2026

From December 2025 to March 2026, gross job gains from expanding and opening private-sector establishments were 7.4 million, a decrease of 478,000 jobs from the previous quarter, a...

Read source
breitbart.com /3 weeks ago

Where GDP Growth Came From: Investment Boom Powers U.S. Economy Despite Tech Sector's Import Dependence

Where the economic growth came from in the third quarter. The post Where GDP Growth Came From: Investment Boom Powers U.S. Economy Despite Tech Sector’s Import Dependence appeared...

Read source
investinglive.com /3 weeks ago

US Wholesale inventories 0.6% vs 0.5% estimate

Wholesale inventories: +0.6% MoM. Prior +0.5%, unrevised.Retail inventories: +0.3% MoM. Prior revised to +0.3% from +0.2%.Wholesale inventories: $1,011.5 billion, up 7.4% YoY.Retai...

Read source
investinglive.com /3 weeks ago

US employment cost index for Q3 +0.8% vs +0.8% expected

Prior quarter was +0.9%Employment benefits +0.9% vs +1.0% prior quarterEmployment wages +0.7% vs +0.9% prior quarterThe US Employment Cost Index (ECI) increased by 0.8% q/q in the...

Read source
qualitymag.com /2 weeks ago

Strong US Economic Growth Driven by Investment in Machinery and Other Capital Goods

Real U.S. economic output increased at an annualized rate of 3.4% in the third quarter of 2026, according to the advanced estimate issued by the Bureau of Economic Analysis.

Read source
seekingalpha.com /1 month ago

The Big Four Recession Indicators: Real Personal Income

Read source
econbrowser.com /4 weeks ago

Forward Price Earnings Ratios

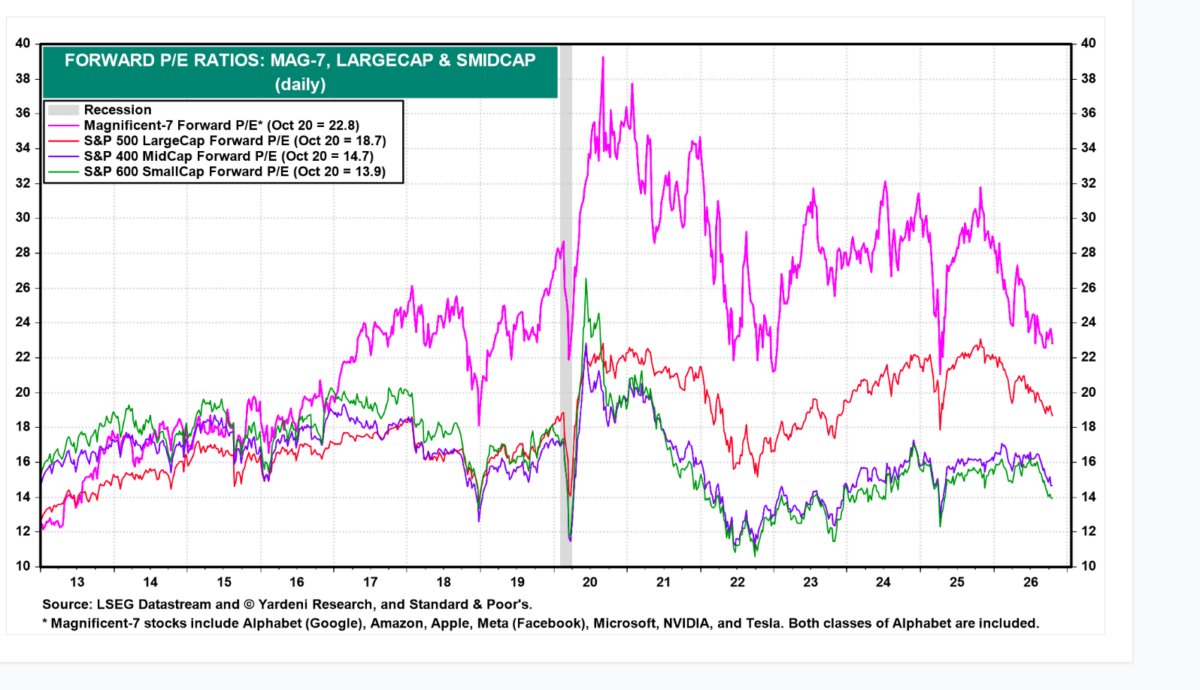
Looking pretty good — although one needs to wonder about analysts’ estimates of forward earnings… Source: Yardeni.com, accessed 22.10.2026. Compare against CAPE:

Read source
econbrowser.com /1 week ago

CRFB Tracks the Administration’s Forecasts So You Don’t Have To

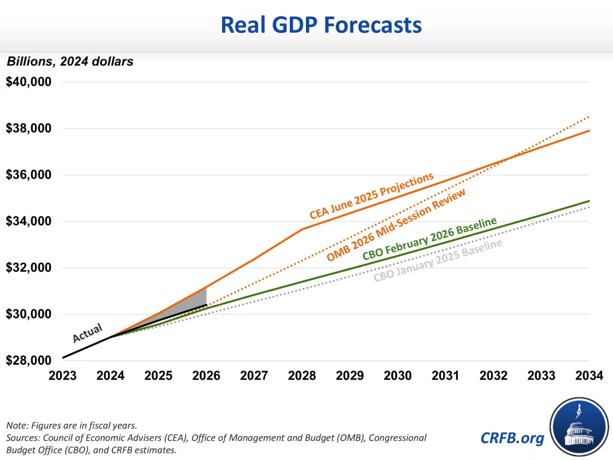
It’s not pretty (CRFB): Source: CRFB. Here’s my comparison, against WSJ, SPF, Hassett, from August (w/o MSR forecast): Figure 1: Reported GDP (bold black), Administration’s FY2027...

Read source
econbrowser.com /4 days ago

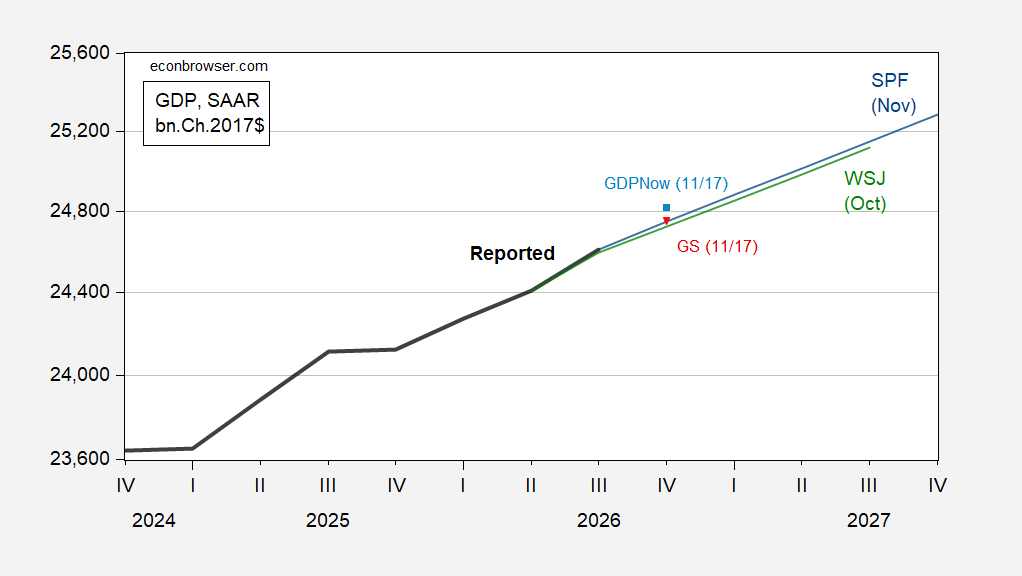
November Survey of Professional Forecasters on GDP Growth

Continued growth, low probability of negative growth. From the Survey: Figure 1: GDP, advance release (bold black), November SPF median (blue), October WSJ survey mean (green), GDP...

Read source

Turn fresh research into a full content calendar

Use SocialBu to discover ideas, generate post drafts, and schedule them across your social channels.