judoscale.com /1 month ago

рџ’Ў Local Dashboards + The (new) Judoscale API

Originally appeared on Judoscale Dev Blog. I like dashboards As long as I’ve been building software, I’ve enjoyed having data about that software on some sort of physical...

Read source
roboticsandautomationnews.com /1 month ago

Data Visualization Consulting: How a Dashboard Audit Works and What it Uncovers

Most organizations don’t have a shortage of dashboards. They have too many. Over the years, reports accumulate – built for a specific meeting, a departed manager, a project that en...

Read source
r-bloggers.com /1 month ago

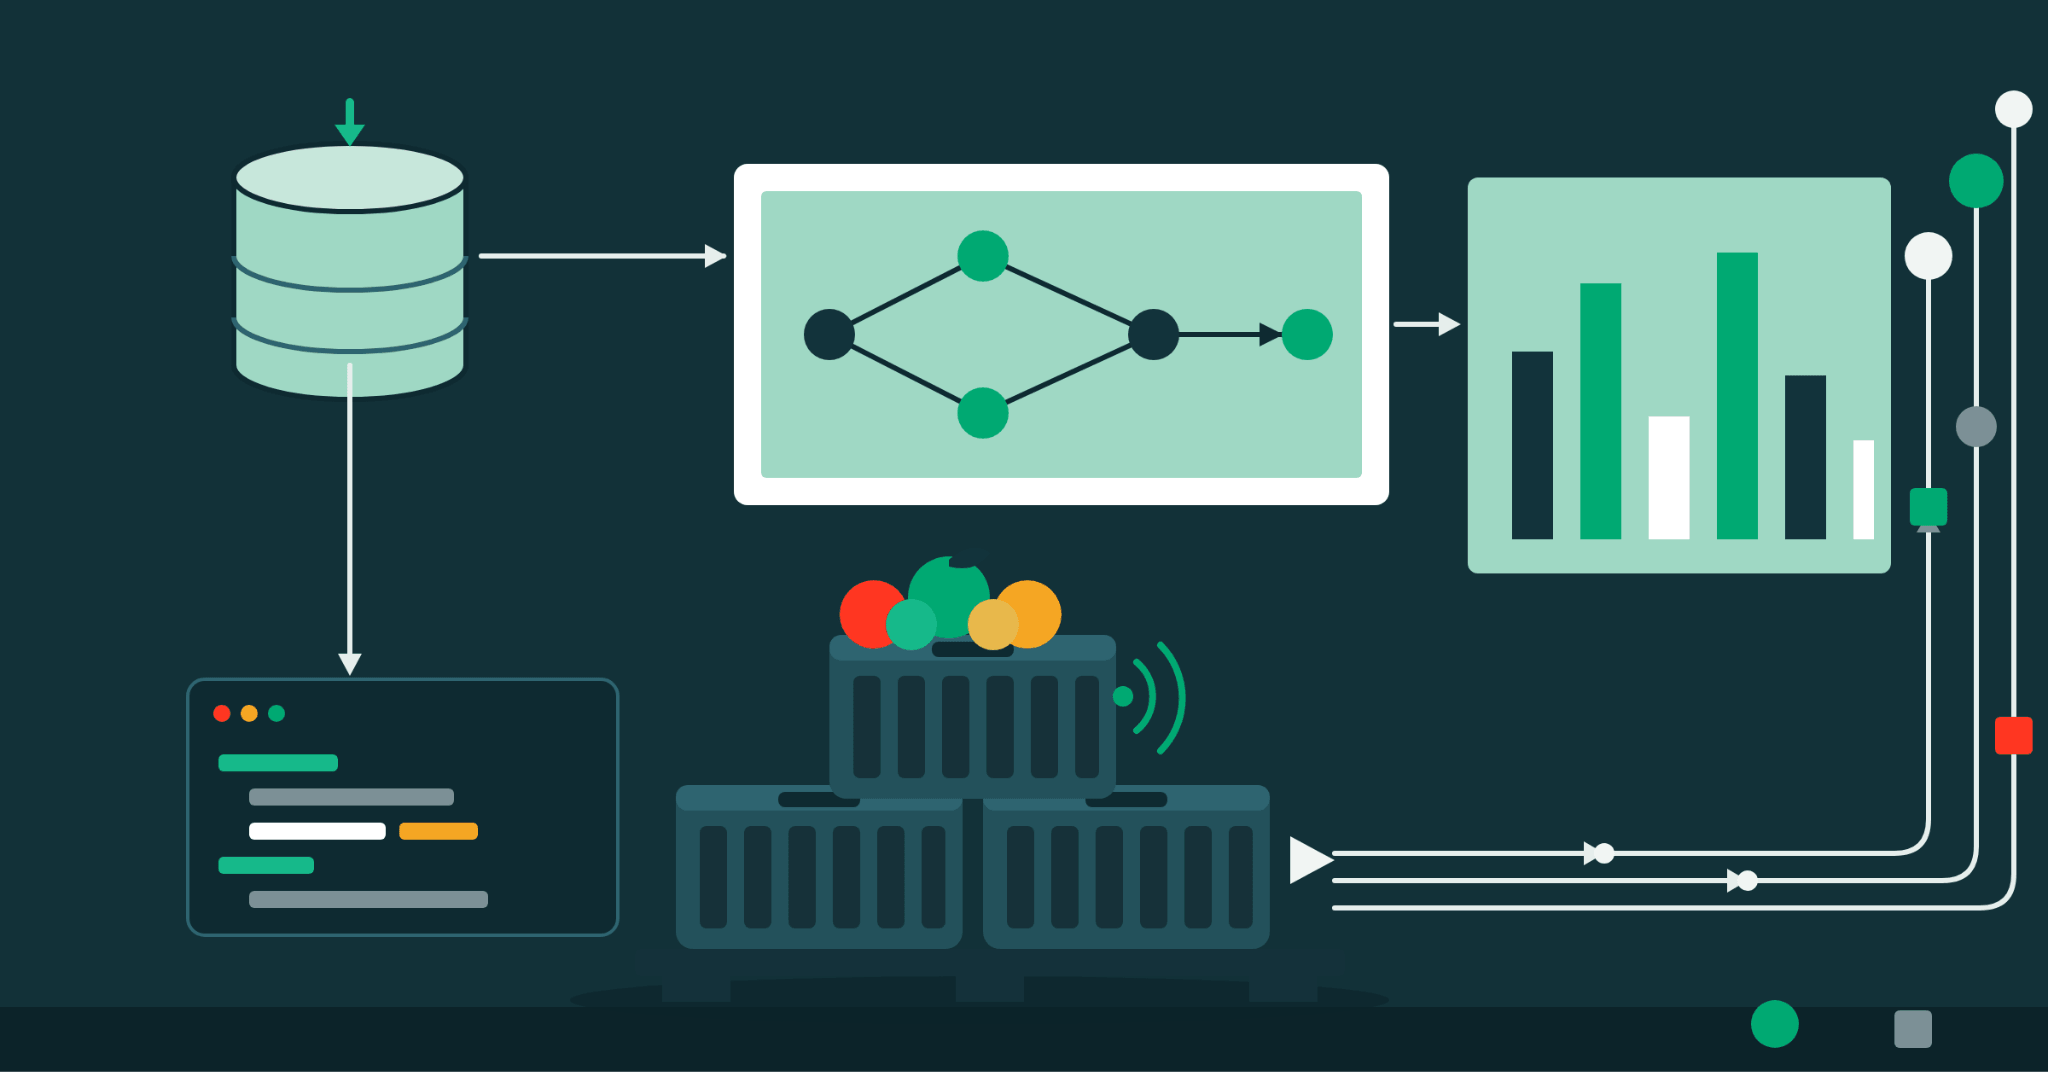
Analytics Pipeline for Dashboards, with Python, R and Javascript

I had a lot of fun this morning, brainstorming and assembling this _Analytics Pipeline_ for Dashboards with Claude (and yes it takes much, much more than only 10 prompts). Contin...

Read source
freelancer.com /1 month ago

Interactive Power BI Sales Dashboard Creation

Power BI Sales Analytics Dashboard | Sales & Profit Analysis Bullet Points / Key Features • Created an interactive Sales Dashboard using Microsoft Power BI. • Analyzed Total Sa...

Read source
wgno.com /4 days ago

Interactive health data dashboard launched in New Orleans

An interactive health data dashboard was launched for New Orleans Tuesday, Nov. 17.

Read source
testingxperts.com /1 month ago

Your BI Dashboard Is Working. But Can You Trust the KPIs?

Your BI dashboard can work perfectly while still reporting the wrong KPI. Explore how BI dashboard testing, independent KPI validation, semantic model validation, and data reconcil...

Read source
infoq.com /23 hours ago

Grafana 13.3 Adds Shared Dashboard Variables and Notebooks

Grafana 13.3 introduces shared variables across dashboards and adds Notebooks to record investigations. Both features are in public preview and require feature toggles for self-man...

Read source
o365reports.com /1 month ago

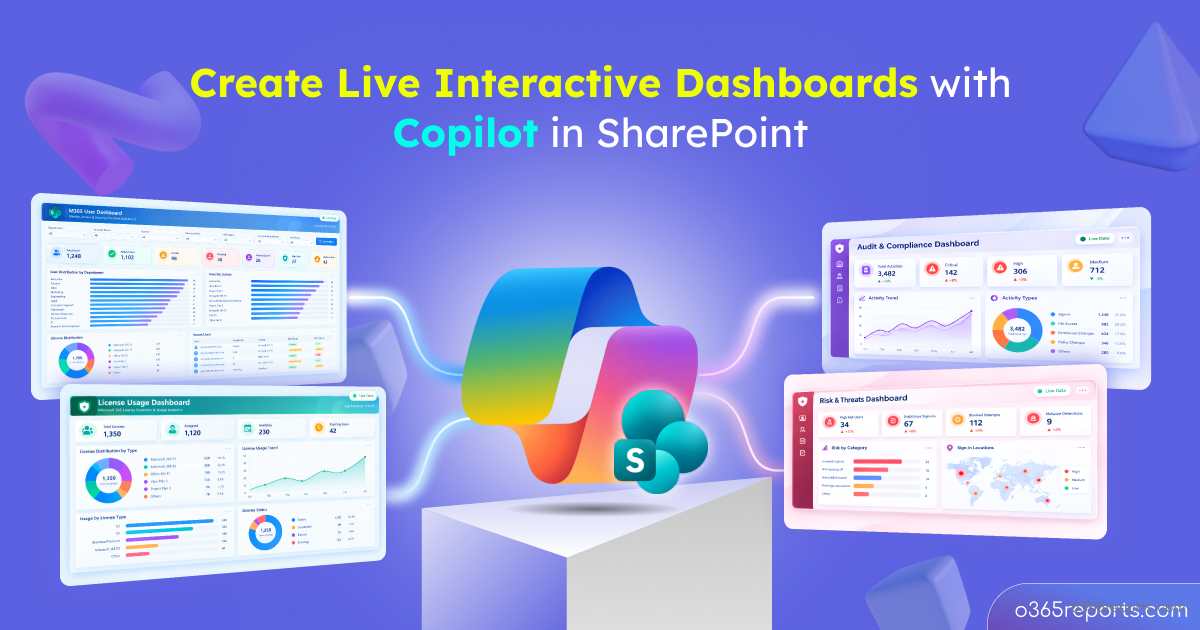
Create Live Interactive Dashboards in SharePoint with Copilot

Turning SharePoint data into a live, interactive dashboard can involve multiple steps. Microsoft 365 Copilot simplifies the process by generating live HTML dashboards directly from...

Read source
databricks.com /1 month ago

Scaling and Operating a Large dbt Project on Databricks: IFCO's Data Team on Performance, Visibility, and Debugging

AbstractIFCO runs one of the world's largest reusable packaging pools with hundreds of millions of crates and pallets...

Read source
habr.com /1 month ago

Как разработать шаблон дашборда для разных подразделений

В одном из BI-проектов мы собирали управленческую аналитику для крупной образовательной организации. В одном контуре должны были работать данные о контингенте, успеваемости, задолж...

Read source
editorialge.com /1 month ago

7 Dashboards You Can Build With Looker Studio for Free

Which articles need attention? Where are website visits coming from? What is holding up the next publication? As a copy editor, these are the questions I want a dashboard to help m...

Read source
databricks.com /2 days ago

Bulk migrate your dashboards to AI/BI with Genie Code

In our previous post, Migrate Your Dashboards to AI/BI with Genie Code, we walked...

Read source
biinsight.com /3 weeks ago

Building Claude Dashboards on Power BI Semantic Models: Step-by-Step Setup, RLS, Sharing and Limitations

Have you ever wanted to build an interactive dashboard directly on top of your existing Power BI semantic models, without opening Power BI Desktop or writing a single line of DAX?...

Read source
medinform.jmir.org /1 month ago

Standardizing Disaster Health Data Visualization Using Fast Healthcare Interoperability Resources in Indonesia: Dashboar...

Background: Health data management during disasters enables responders to assess the needs of survivors, efficiently allocate resources, and monitor survivors’ health conditions. H...

Read source
databricks.com /1 week ago

Unity Catalog Metric Views, now in Power BI: one unified, governed semantic layer for all your reporting and AI

Organizations want a single, trusted definition of their business semantics. Revenue,...

Read source
projectmanagertemplate.com /2 weeks ago

Project Performance Dashboard: KPIs, Metrics, and Design Principles for Effective Project Control

Learn how to design a project performance dashboard that connects KPIs, schedule and cost forecasts, risk exposure and delivery measures to practical decisions.

Read source
beefmagazine.com /1 month ago

Meat Institute launches enhanced benchmarking dashboards

Participants can view both company- and establishment-level performance and aggregated industry data.

Read source
uxplanet.org /1 month ago

Dashboard design becomes easier with Claude

Claude Dashboard is a new artifact recently introduced by Anthropic. Dashboard design is one of the most common product design tasks, so I…Continue reading on UX Planet »

Read source
geeky-gadgets.com /1 month ago

Why Nobody Uses Your Power BI Dashboard and How to Fix It

Many Power BI dashboards fail to gain traction because they don’t address what users truly need. According to Mo Chen, common issues include neglecting stakeholder priorities, over...

Read source
cloud.google.com /4 days ago

The visual evolution of Looker: Modern design for enterprise data storytelling

Over the past year, we’ve focused on making Looker easier to use for every business user. We started by redesigning the exploration experience with drag-and-drop workspaces, stream...

Read source
cloud.google.com /1 month ago

Trusted Data Apps for the Agentic Data Cloud, powered by Looker

As a business intelligence user, this probably sounds familiar: Most dashboards only provide you with a standardized canvas and a fixed library of charts, and the “analysis” consis...

Read source
freelancer.com /3 weeks ago

Power BI Dashboard Development Expert

Key Responsibilities Report & Dashboard Design: Build clear, interactive visualizations, graphs, and reports using Power BI Desktop. Data Preparation (ETL): Extract, clean, an...

Read source
uxplanet.org /5 days ago

Anthropic Just Launched Claude DATA

Complete guide to mastering dashboard creation and data visualization in Claude CodeContinue reading on UX Planet »

Read source
habr.com /1 month ago

Мы перестали смотреть на дашборды расходов и добавили стоимость прямо в интерфейс Databricks

А что если вместо дашборда по затратам Databricks добавить их прямо в интерфейс. С этой идеи начался наш мини проект, который решал сначала нашу локальную проблему, а теперь доступ...

Read source

Turn fresh research into a full content calendar

Use SocialBu to discover ideas, generate post drafts, and schedule them across your social channels.