nishantrana.me
/1 month ago
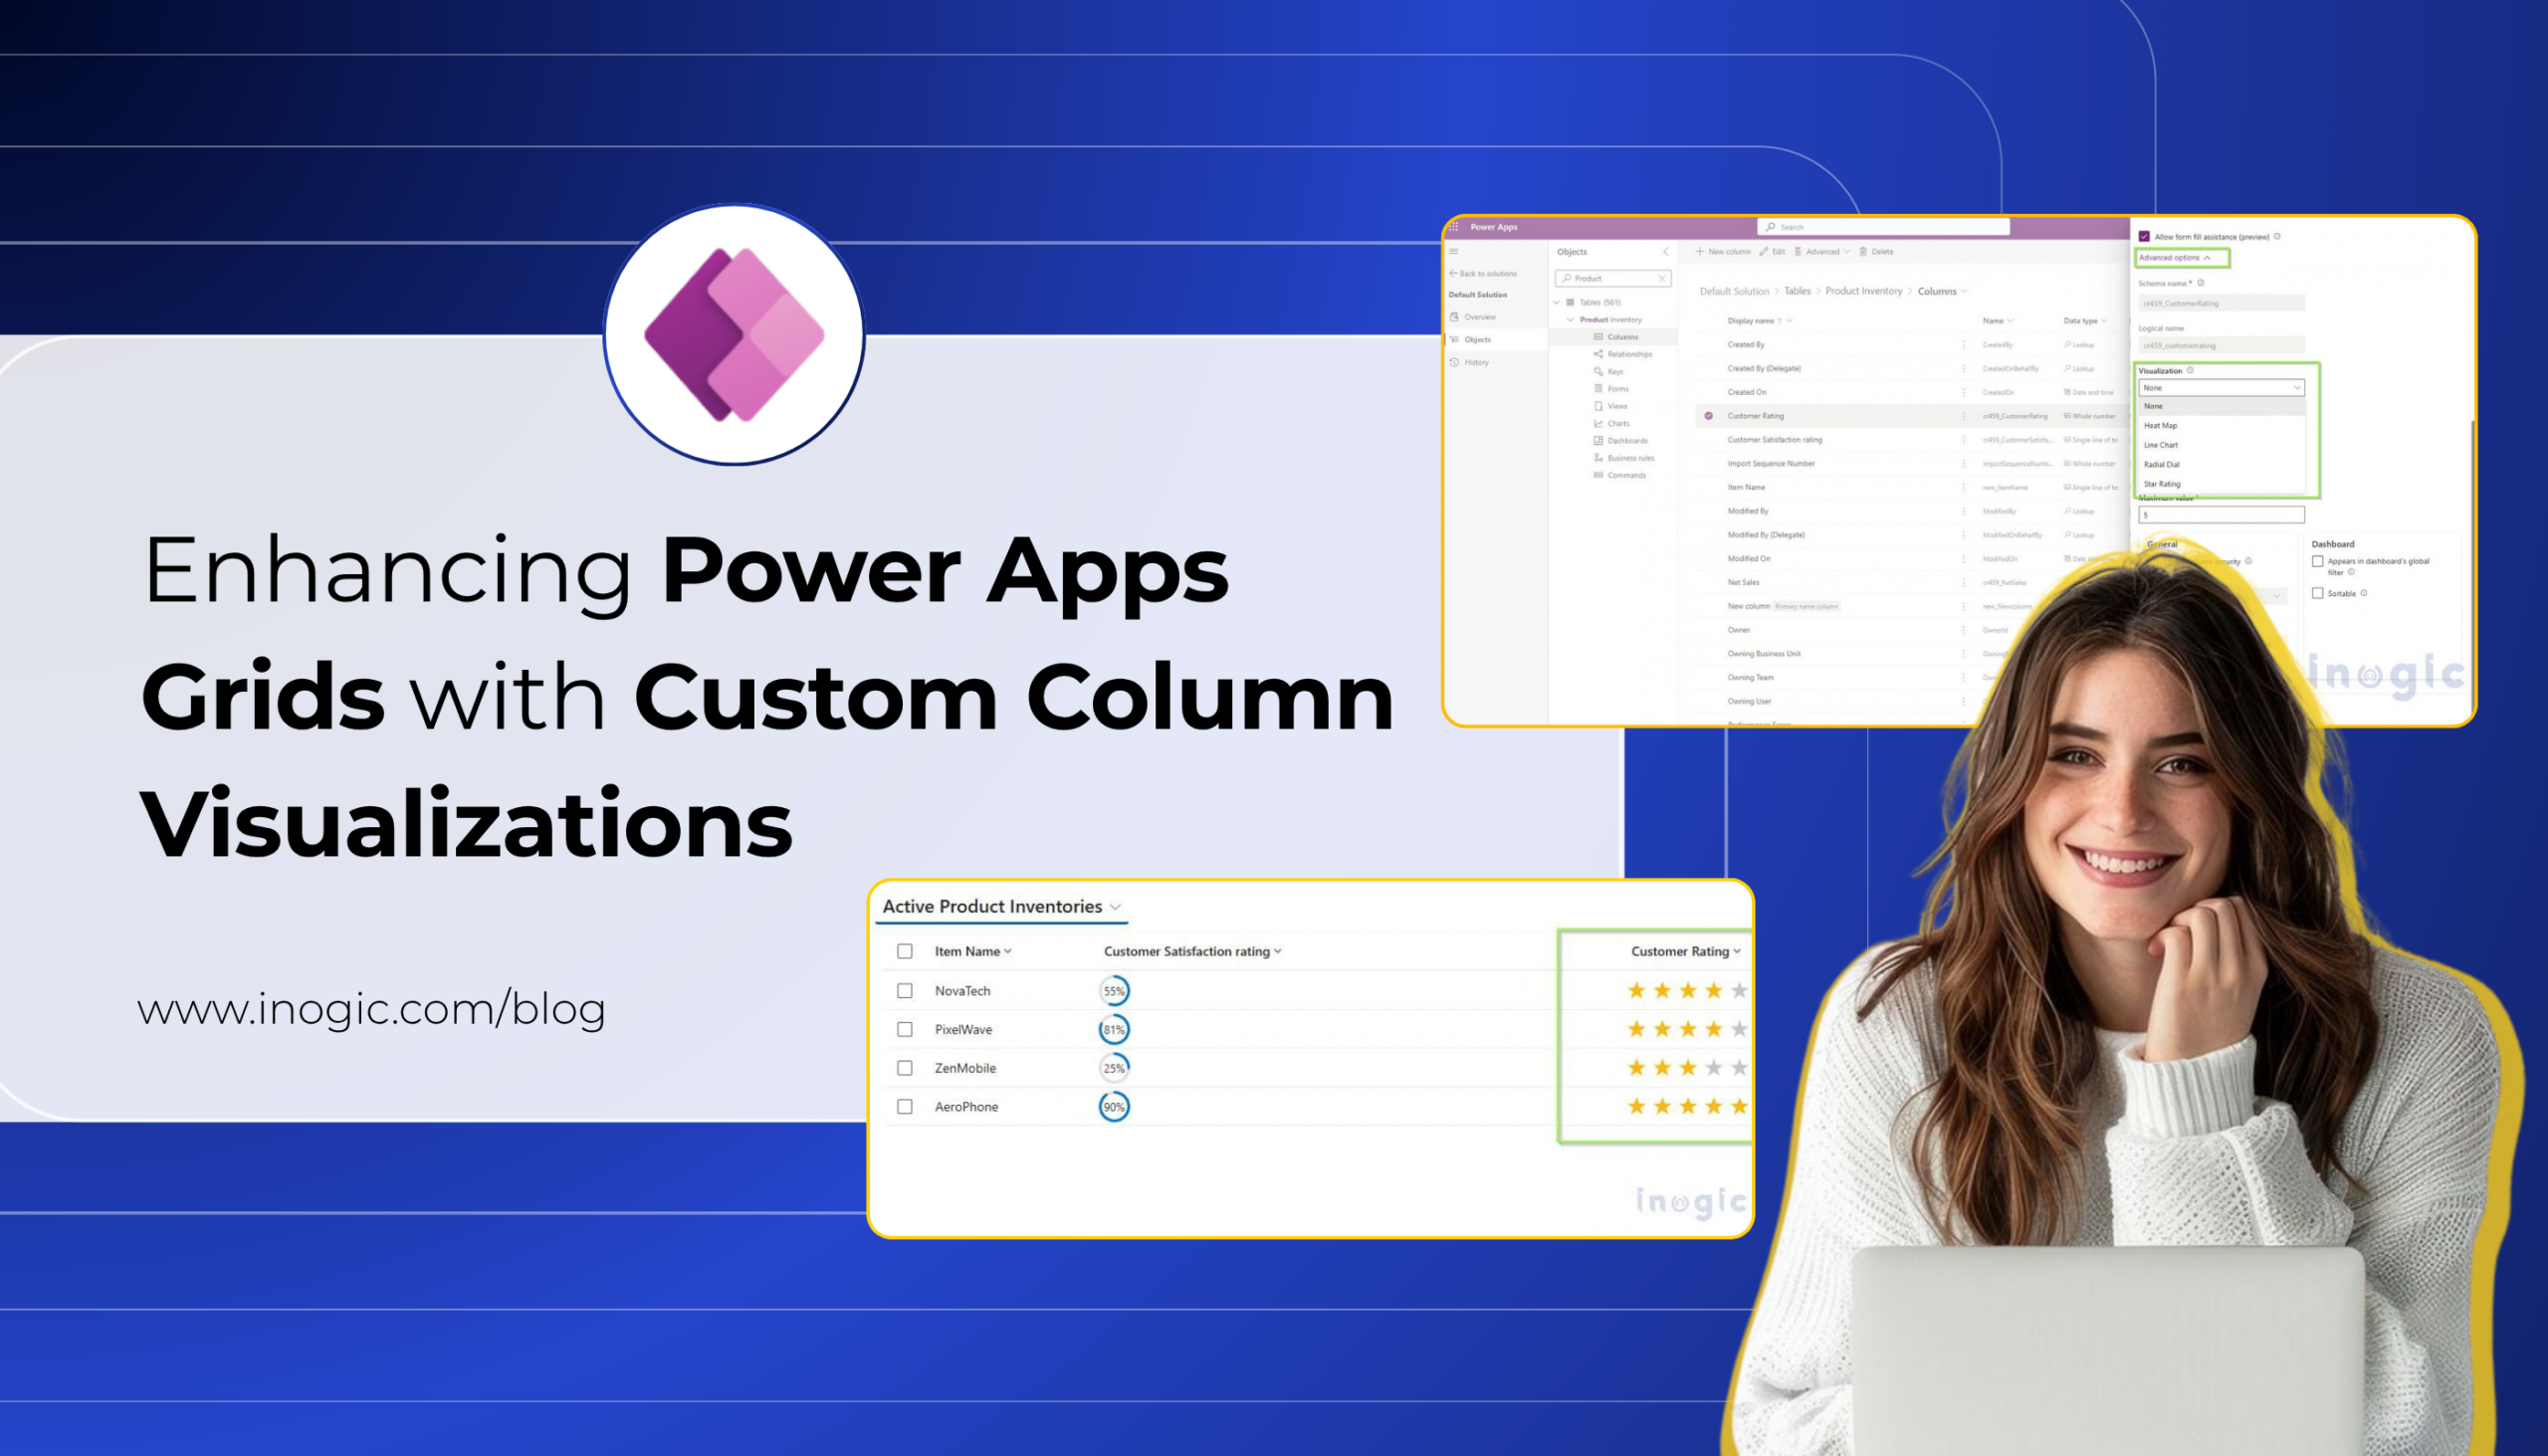
Column Visualizations for Grids / Views (Preview) –Dataverse / Dynamics 365
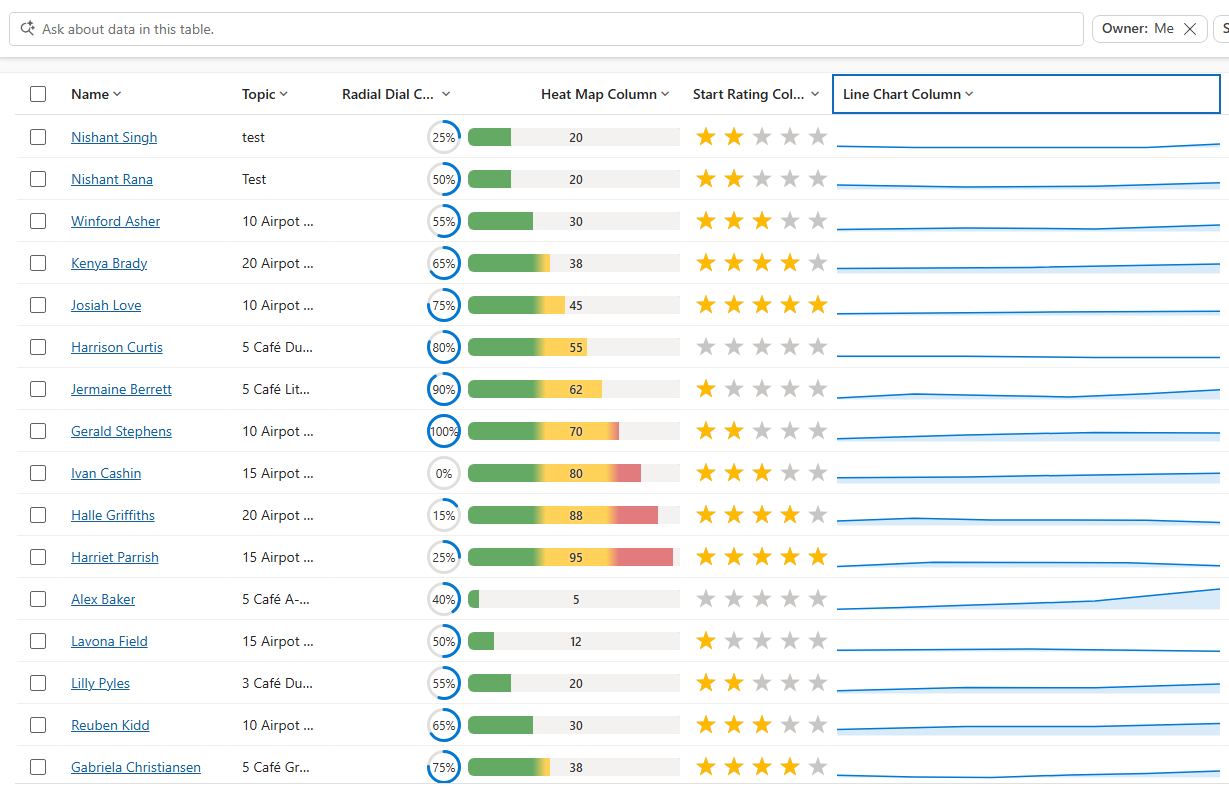
Power Apps now lets us render a column’s data as a small graphic in the grid – a gauge, a sparkline, a colored bar, or stars – instead of plain text. We tried it out on a couple of...