syncfusion.com
/1 day ago
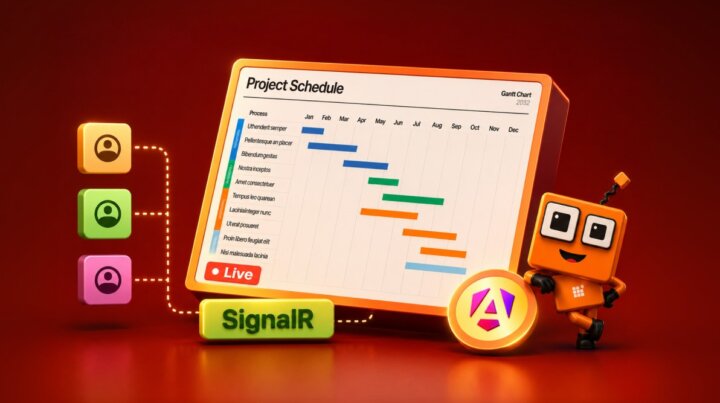
Real-Time Angular Gantt Chart with SignalR: Multi-User Project Sync Without Refresh
Enable real-time updates in Angular Gantt Charts with SignalR, keep timelines synced instantly, reduce stale data, and improve team collaboration without refresh.