Latest updates for 3D Data Visualization

Fresh curated links around 3D data visualization are collected here so marketers can spot useful updates and turn timely ideas into posts faster.

Recent items include:

  • Efficiently Manage Complex Data Sets with Data Visualization
  • Population pyramid in 3-D and over time
  • SuperSplat Editor 3.0 is a huge performance update

Post angles to try

Share the most useful takeaway for your audience.
Turn one article into a quick practical checklist.
Ask your audience how this shift affects their work.
Turn angles into scheduled posts

Fresh articles and ideas

Recent curated links from global sources. Generate one free draft from any story, then use SocialBu to schedule and refine your content calendar.

everlaw.com /1 month ago

Efficiently Manage Complex Data Sets with Data Visualization

Efficiently Manage Complex Data Sets with Data Visualization by Giulianno Lopez
Read source
flowingdata.com /2 weeks ago

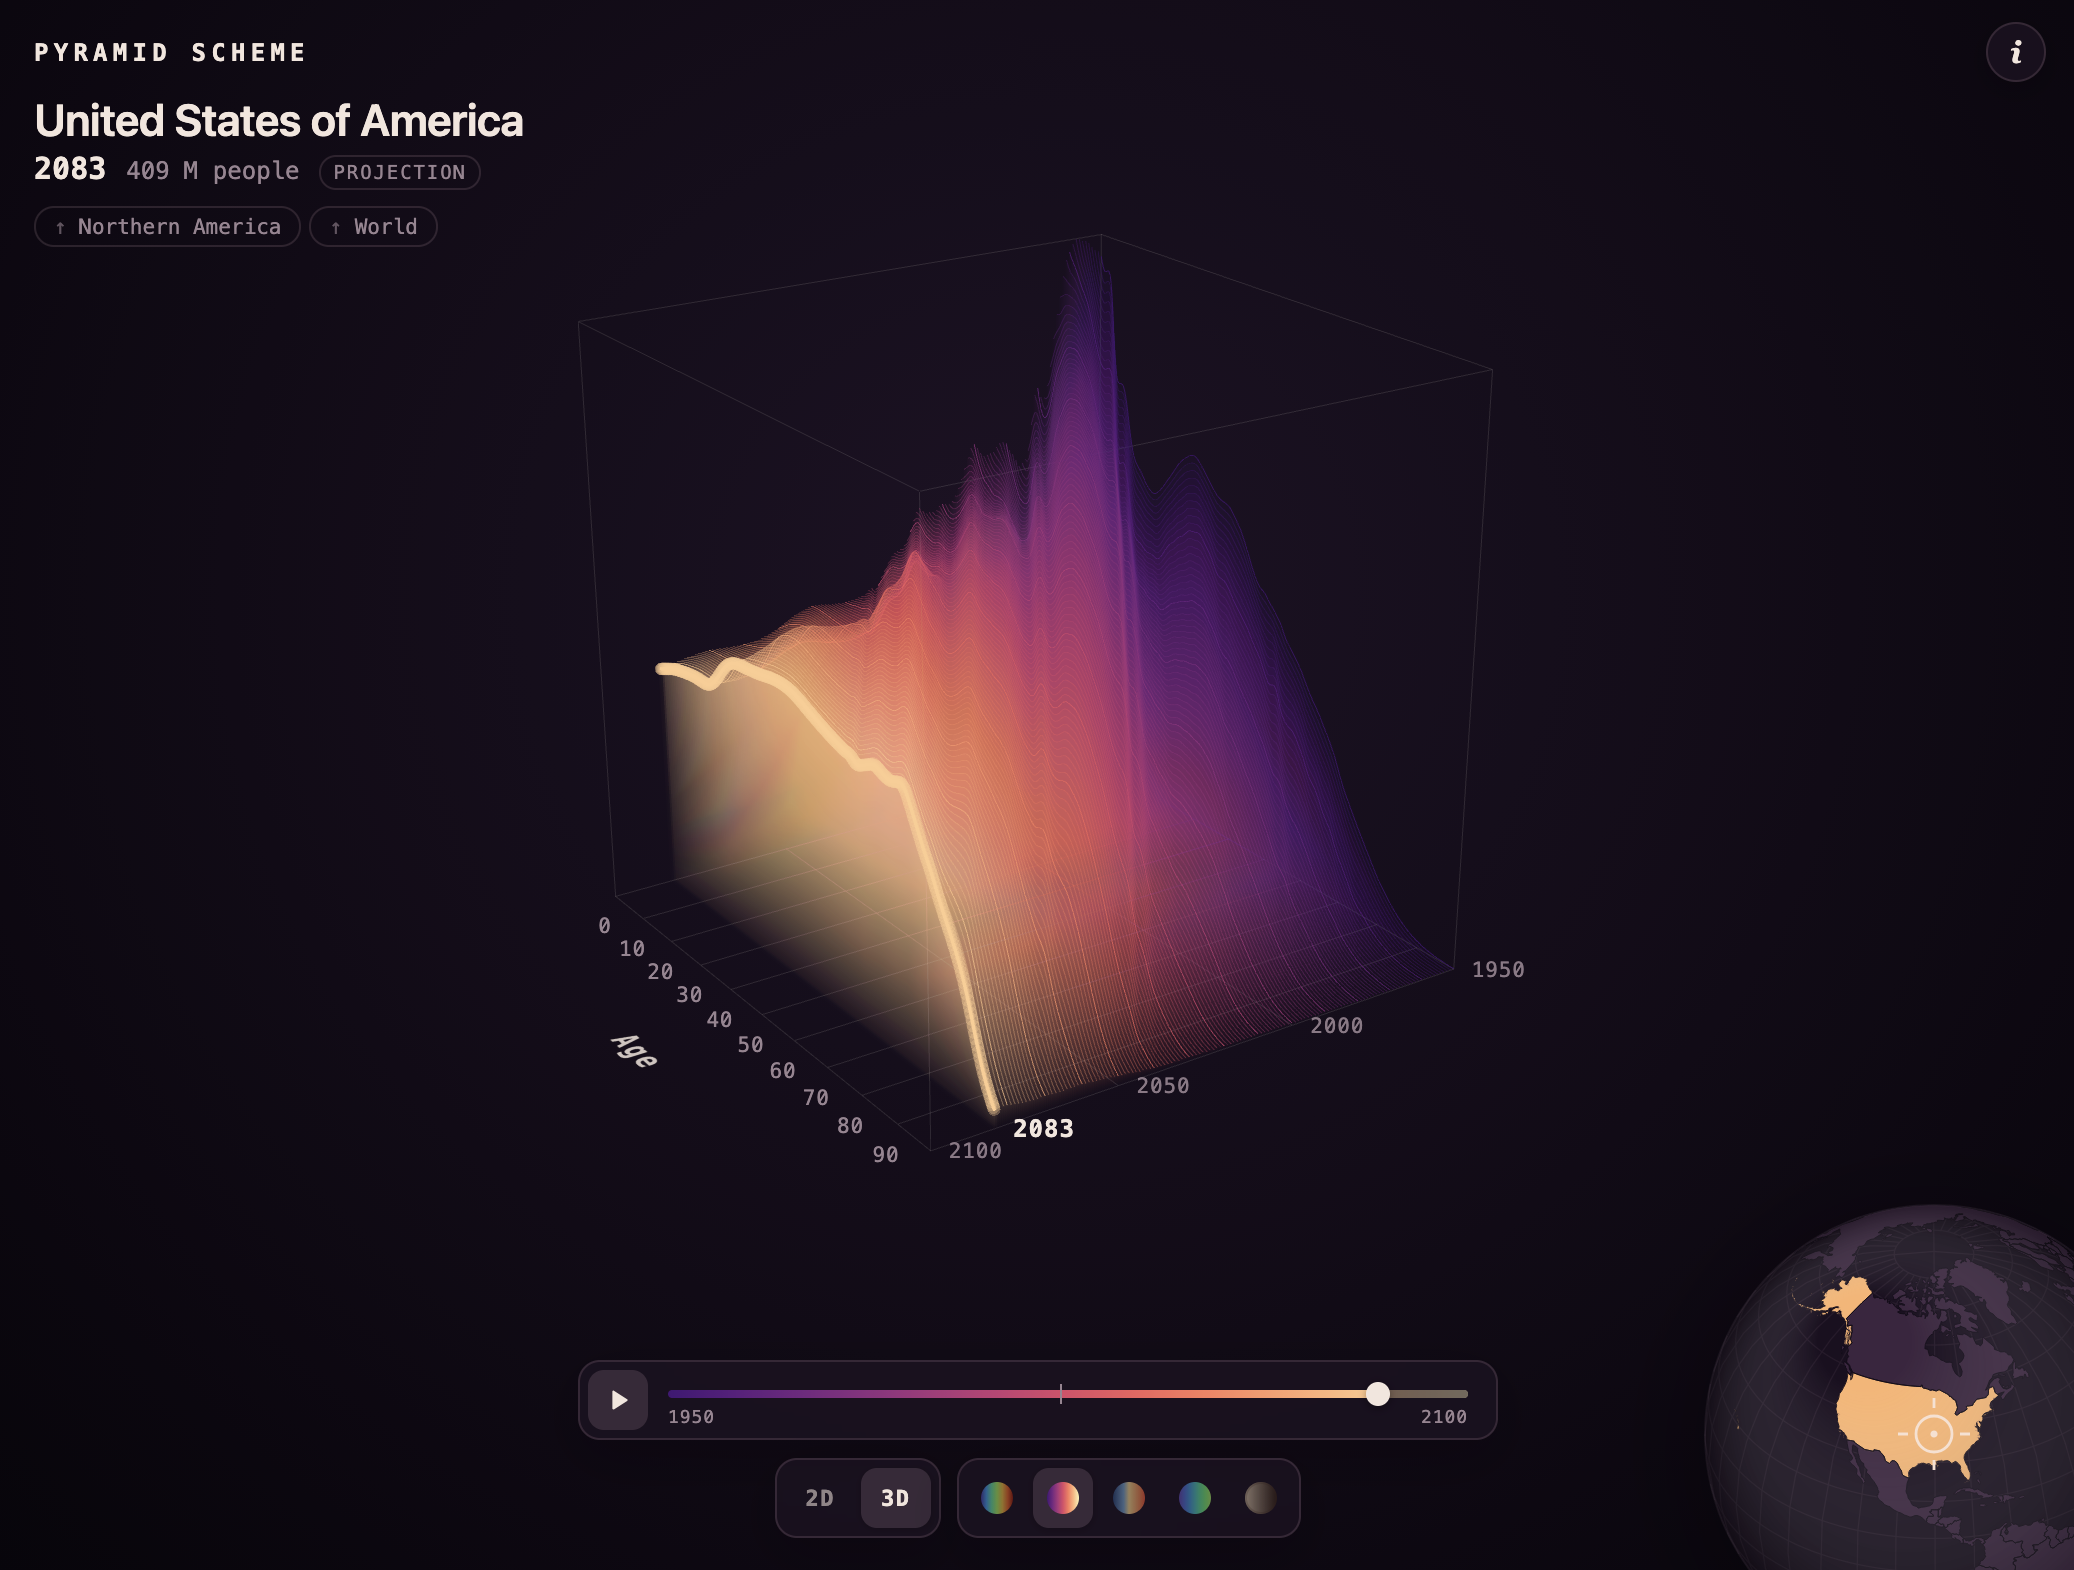
Population pyramid in 3-D and over time

A population pyramid shows the age distribution of a population, usually with counts…Tags: Karim Douïeb, population, world

Read source
cgchannel.com /1 month ago

SuperSplat Editor 3.0 is a huge performance update

Big update to the free online tool for viewing and editing 3D Gaussian Splats lets you visualize tens of millions of Gaussians smoothly.

Read source
anychart.com /3 weeks ago

Hand-Picked New Data Graphics in the Wild — DataViz Weekly

Looking for real-world examples of data visualization done well? DataViz Weekly gathers them on the AnyChart blog. We pick projects from what gets published across the web and pres...

Read source
anychart.com /1 month ago

Good Data Visualization, Found and Passed Along — DataViz Weekly

Data visualization is what we work on the rest of the week. On Fridays, we go through what got published around the web, keep the pieces that hold up, and put them in DataViz Weekl...

Read source
awwwards.com /2 weeks ago

Lidar Drone Scanning

A Riotters R&D experiment turning raw drone LIDAR scans into a real-time 3D point cloud, rendered live in the browser with WebGL.

Read source
anychart.com /3 weeks ago

Data Visualization Examples From Four Newsrooms — DataViz Weekly

We regularly sift through the data visualization that appears online, choose notable projects, and feature them in DataViz Weekly as examples. This time, all four come from newsroo...

Read source
googlemapsmania.blogspot.com /3 weeks ago

Providing Global Relief

Bert Spaan has taken Mapterhorn's global terrain data to create an interactive global Relief map. What is particularly interesting about this new map is that, unlike traditional to...

Read source
github.com /1 month ago

Turn the five Platonic solids in 3D, show their duals, and read their measurements

Comments

Read source
anychart.com /1 week ago

More Data Visualization Examples to Bookmark — DataViz Weekly

DataViz Weekly is back with more data visualization examples. As usual, we have been tracking what the web has to offer and singling out some of the most memorable projects we came...

Read source
bioengineer.org /1 month ago

Affordable handheld 3D ultrasound reconstruction system developed with visual positioning

Ultrasound imaging has always been medicine’s great equalizer—cheap, safe, portable, and free of ionizing radiation. But it has also remained stubbornly flat. Where computed tomogr...

Read source
jotform.com /1 week ago

6 best AI data visualization tools in {! YEAR !}

You could write at length about last quarter’s sales, the economy of Ecuador, the adoption of alternative energy sources, or any other large data set. No single stat or trend, thou...

Read source
qualitymag.com /3 weeks ago

GeoDict Quantify

Math2Market GmbH announced the launch of GeoDict Quantify, a focused, cost-effective software package for processing and quantitatively analyzing micro-CT and other high-resolution...

Read source
anychart.com /6 days ago

Visualizing Data on Voters, Energy, Buildings, Temperatures — DataViz Weekly

From the data visualization we keep coming across on the web, some projects catch our attention more than the rest. DataViz Weekly is where we spotlight them as examples. Here are...

Read source
everlaw.com /1 month ago

Now Introducing Data Visualization and a Predictive Coding System Upgrade

Now Introducing Data Visualization and a Predictive Coding System Upgradeby Everlaw...

Read source
r-bloggers.com /1 month ago

Visualising High-dimensional Data with R workshop

Join our workshop on Visualising High-dimensional Data with R, which is a part of our workshops for Ukraine series! Here’s some more info: Title: Visualising High-dimensional Data...

Read source
everlaw.com /1 month ago

Challenging Search Terms and Scope of Discovery with Data Visualization

Challenging Search Terms and Scope of Discovery with Data Visualizationby Everlaw .....

Read source
rooferscoffeeshop.com /1 month ago

Visualization transforms the home improvement sales experience

visualization-transforms-the-home-improvement-sales-experience

Read source
dzone.com /1 month ago

3D Air Quality Maps With Neo4j, Python, and R

Air quality across the Pyrenees corridor is a pressing concern, particularly during summer heatwaves and wildfire seasons. In this region, cities on both sides of the French-Spanis...

Read source
uploadvr.com /1 month ago

The Best Ways To View Gaussian Splats On Quest

Here's a rundown of the best apps and tools to view Gaussian splats on a Quest headset.

Read source
flowingdata.com /1 month ago

вњљ Application of charts and data

This week is about adapting our visualization workflow as the tools change dramatically.Tags: analysis, tools

Read source
anychart.com /1 month ago

Data Visualization Projects to See for Yourself — DataViz Weekly

Good data visualization gets published constantly, and a lot of it scrolls past before anyone notices. DataViz Weekly is our attempt to slow that down. Each Friday we pull a few pi...

Read source
sourcetrail.com /3 weeks ago

Mastering Embedded Graphs and Data Visualization in Node.js

Learn how to build powerful embedded graphs in Node.js. From network analysis with Cytoscape.js to real-time dashboards and headless rendering. The post Mastering Embedded Graphs a...

Read source
awwwards.com /2 weeks ago

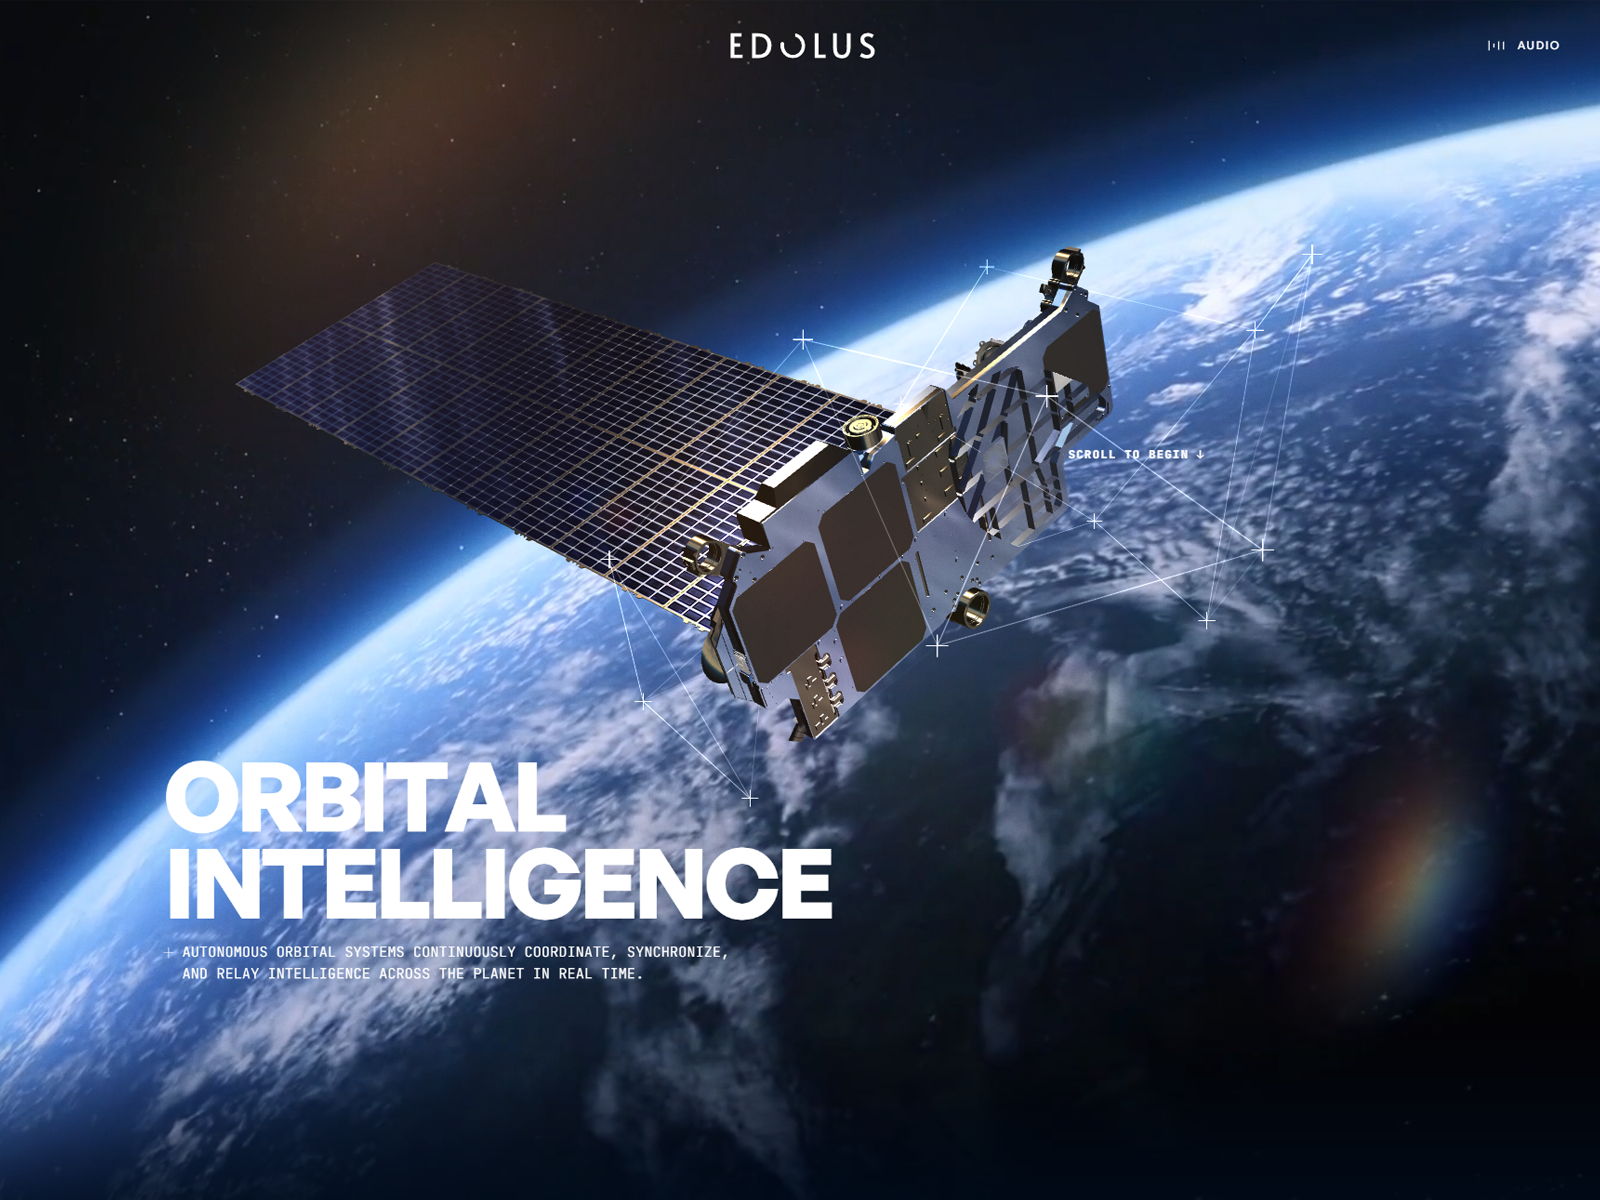
EDOLUS

A cinematic WebGL journey into AI infrastructure. Pushing the limits of real-time 3D, immersive UX, and dynamic sound design. Engineered by Vertex3D.

Read source

Turn fresh research into a full content calendar

Use SocialBu to discover ideas, generate post drafts, and schedule them across your social channels.

Sources covering 3D Data Visualization

feeds.dzone.com

Recent coverage from public sources
Public source

feeds.feedburner.com

Recent coverage from public sources
Public source

feeds2.feedburner.com

Recent coverage from public sources
Public source

bioengineer.org

Recent coverage from public sources
Public source

flowingdata.com

Recent coverage from public sources
Public source

uploadvr.com

Recent coverage from public sources
Public source