
In 2026, X (Twitter) is one of the most influential social media platforms. Understanding who uses X (Twitter), how they engage, and which content formats perform best is essential for making informed decisions.
This post is updated for 2026 X (Twitter) statistics planning with the latest available figures and reputable research. It highlights user behavior, demographic shifts, engagement trends, and platform performance. These X (Twitter) statistics enable you to align your content and marketing efforts with verified insights for an effective social media strategy.
If your goal is to grow on X (Twitter) and strengthen your brand presence in 2026, these X (Twitter) statistics in 2026 you’ll find here are your starting point.
Note: X does not publish one single official MAU figure, so some ‘user’ metrics are estimates; this post prioritizes ad-tool reach and major research sources.
X (Twitter) Statistics 2026: Key Numbers Marketers Need
The platform has undergone numerous changes since its acquisition by Elon Musk, but its fundamental role remains the same: it is the go-to place for live, public conversation.
For marketers, this makes it a unique and vital tool for tapping into what’s happening right now.
1. X is the Most Popular Social Media Platform Worldwide
With over 611 million monthly active users, X (Twitter) remains a major global platform, especially for real-time news and public discussion. While not as large as Facebook or Instagram, its influence in media, politics, and real-time events far outweighs its rank.
What this means for brands: X offers a concentrated, highly engaged audience. You don’t need to reach everyone, just the right people who are actively shaping conversations.
2. Elon Musk Bought Twitter for $44 Billion
On October 28, 2022, Elon Musk’s landmark $44 billion acquisition of Twitter transformed it into X. Linda Yaccarino was later appointed CEO to lead its business and advertising operations. Linda Yaccarino stepped down as CEO in July 2025.
What this means for brands: The platform is still in a period of rapid change. Stay agile and be prepared to adapt your strategy as new features and policies are introduced.
3. X.com is the Fifth-Most Visited Website in the World
X.com ranks as the sixth most-visited website globally. This incredible volume of traffic shows its role as a primary source for breaking news, entertainment, and public discourse.
What this means for brands: Your presence on X has a massive potential for visibility. So use it to reach your target audience.
Make Your X (Twitter) Strategy Even Better
4. The Most Followed X Account is @ElonMusk
With over 230.6 M followers, platform owner Elon Musk is the most-followed account on X.
What this means for brands: The platform’s direction and features are heavily influenced by its owner’s vision. Paying attention to his posts can offer clues about upcoming changes.
X User Growth & Audience Size Statistics
A platform is only as valuable as the people on it. While headlines have debated X’s trajectory, the data shows a massive user base that remains a crucial audience for marketers to engage.
5. X Reaches Over 611 Million Monthly Active Users
Despite the competition, X maintains a significant global rank with 611 million users (this is a third-party estimate) logging in at least once a month.
What this means for brands: Your target audience is almost certainly on X. The platform’s scale provides ample opportunity for both broad brand awareness campaigns and niche community engagement.
6. Approximately 245 Million Users Engage with the Platform Daily
With 245 million monetizable daily active users, the platform has a deeply engaged audience. They check in for real-time updates and conversations every single day.
What this means for brands: X isn’t a “check it on the weekend” app. It’s an “always-on” environment, ideal for making timely announcements, covering live events, and participating in trending moments.
7. 70,000 People Join New Communities on X Daily
X Communities are growing. An average of 70,000 users join new communities each day, seeking out niche groups dedicated to specific interests, from B2B marketing to video games and sports.
What this means for brands: Don’t just broadcast; participate. Joining or creating a Community lets you engage with a highly qualified, self-segmented audience in a more focused, meaningful way.
X (Twitter) Statistics for User Demographics and Behavior Insights
Who exactly are these hundreds of millions of users, and what are they doing on the platform?
Understanding demographics and user habits is key to creating engaging content that resonates with them and sparks meaningful communication.
8. 33% of U.S. Adults Aged 18-29 Use X
Pew Research shows that X is most popular among younger adults, with 33% of Americans aged 18-29 using the platform. This makes it a prime channel for reaching Gen Z and younger Millennials.
What this means for brands: If your target demographic includes young adults, X is an essential channel. Your brand voice and content must align with the authentic, fast-paced nature this audience expects.
9. The User Base Skews Male at 60.9%
Globally, X’s user base is comprised of 60.9% males and 39.1% females. This is a key demographic insight to consider when developing user personas and tailoring your messaging accordingly.
What this means for brands: The platform is for everyone. However, this gender distribution may influence the tone and topics that gain the most traction, particularly in niche areas such as technology, sports, and finance.
10. 48% of Users Turn to X to Get the Latest News
A survey reveals that getting news is the top reason people use X, with 48% of users citing it as a primary motivation. An equal percentage (48%) also uses it for entertainment.
Here’s a further breakdown:
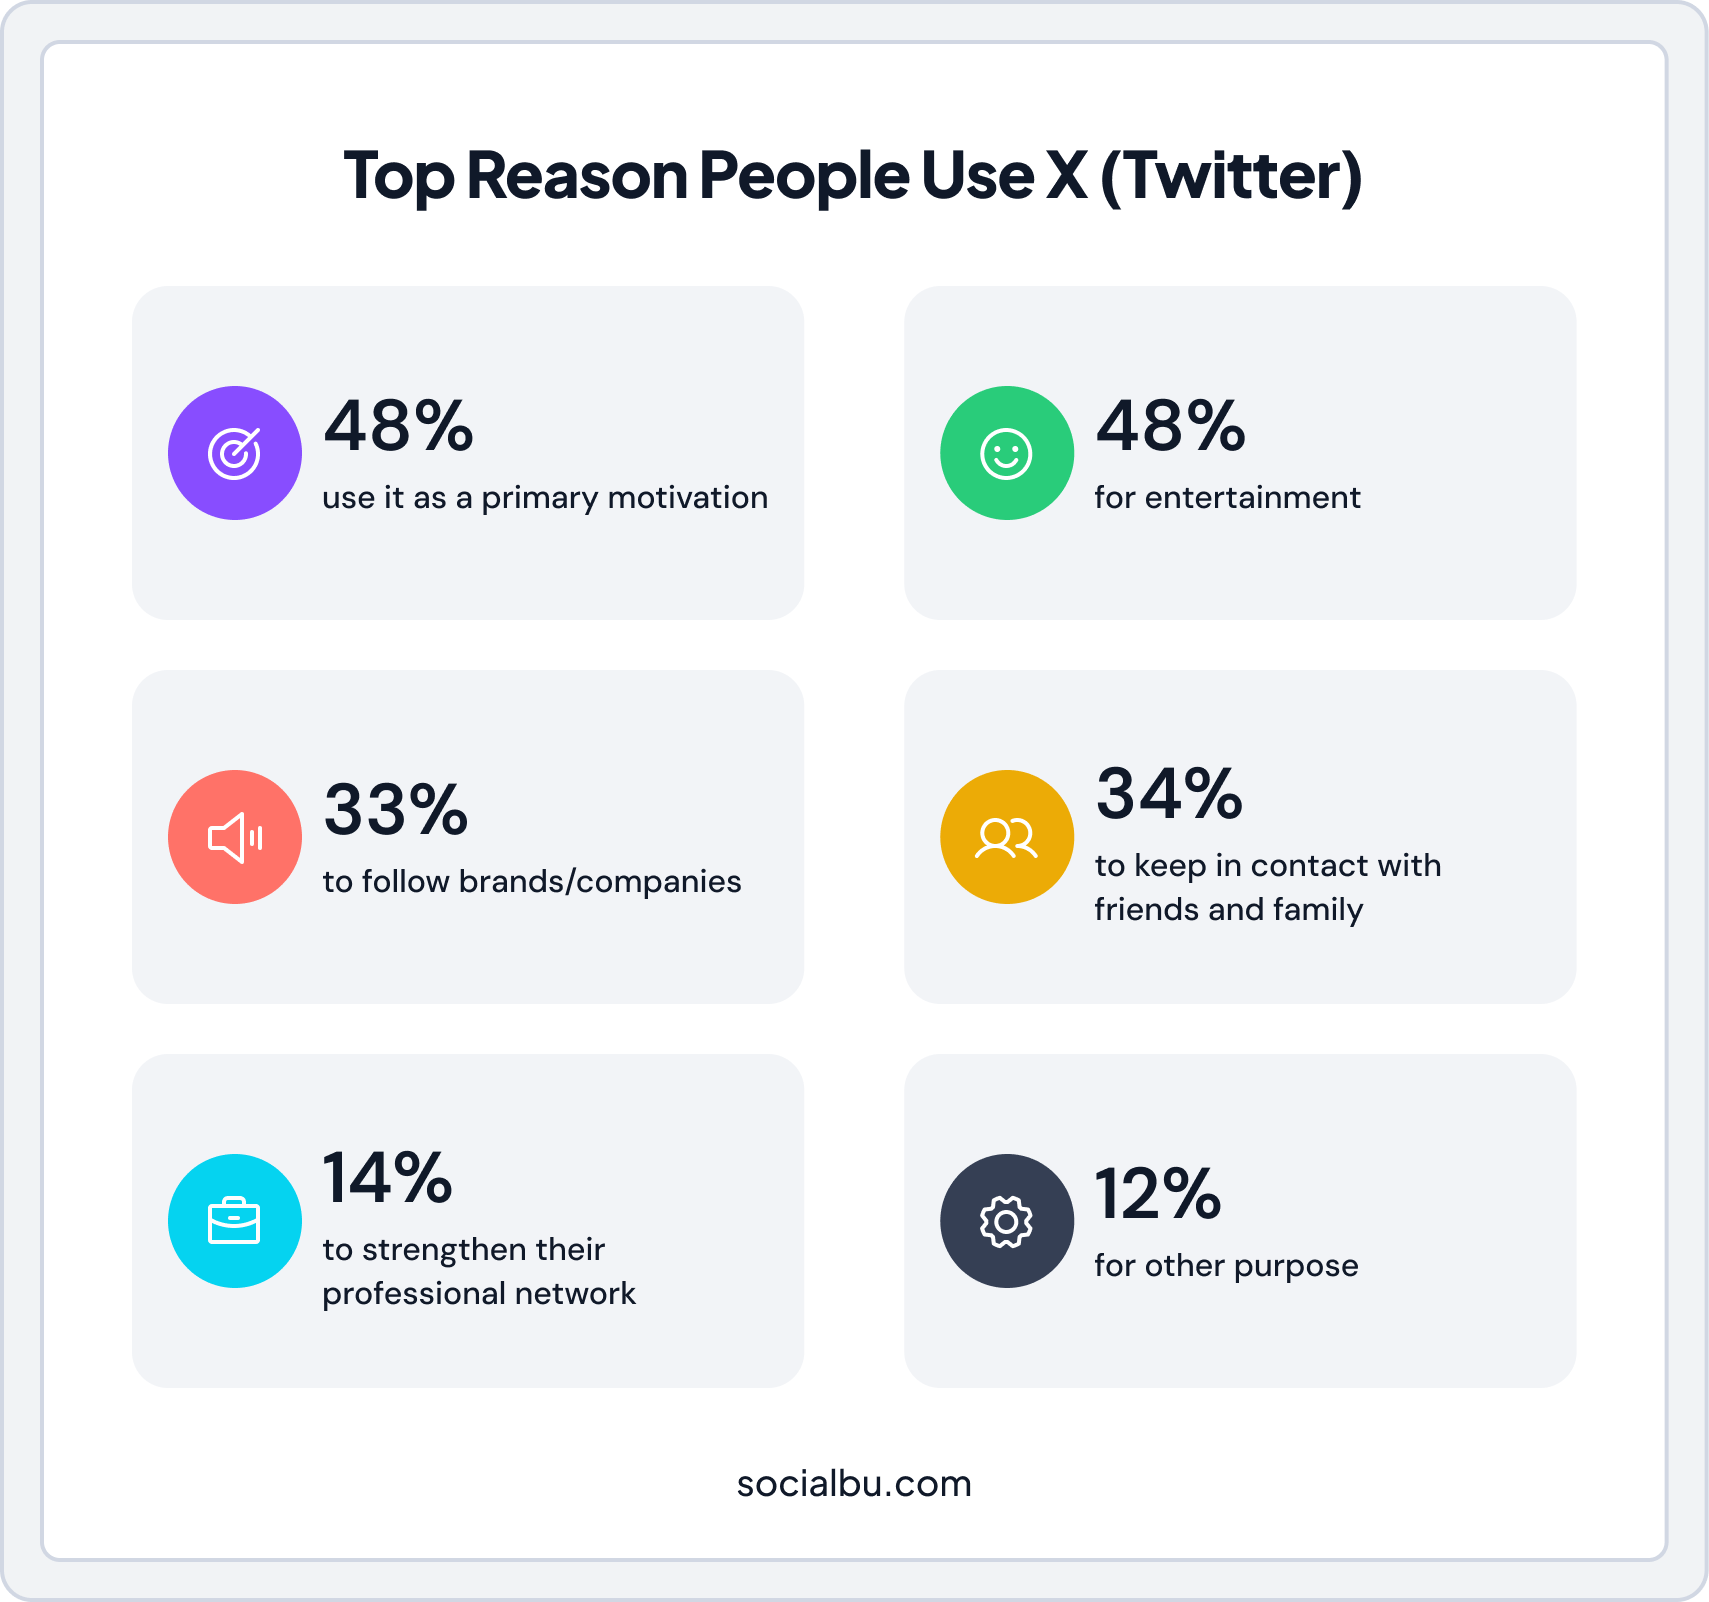
What this means for brands: Position your brand as a source of valuable information by sharing industry news, insightful commentary, and helpful tips that align with this primary user behavior.
11. The U.S. Leads with 103.96 Million Users
The United States has the most extensive X user base, with 103.96 million users. It is followed by Japan (70.92 million) and Indonesia (25.16 million), making these three countries the top strategic markets on the platform.
What this means for brands: Tailor your content strategy for these key regions. Consider language, cultural relevance, and time zones to maximize engagement in these high-value markets.
12. Users Spend 364 Billion Active Seconds on X Per Day
In 2024, the total time spent on the platform was a staggering 364 billion active seconds daily. This metric reflects deep user immersion and offers significant opportunities for brands to capture attention.
What this means for brands: Your content needs to be compelling and engaging enough to stop the scroll and earn a few of those valuable seconds.
13. Over 88.55% of X’s User Base is Mobile-First
The overwhelming 88.55% users access X through their mobile devices. This behavior shows that content must be optimized for vertical viewing, quick consumption, and on-the-go interaction.
What this means for brands: Go mobile-first, always. Ensure your images and videos are vertically oriented, text is legible on small screens, and any links lead to mobile-friendly pages.
Content and Engagement X (Twitter) Statistics in 2026
Understanding the audience is half the game; the other half is creating content they love and engage with.
These stats show what works on X, from content formats to posting times, helping you refine your content calendar for maximum impact.
14. At Least 500 Million Tweets Are Sent Every Day
The volume of content on X is immense, with over 500 million posts shared daily. This includes everything from simple text-based thoughts and visual threads to polls and video clips.
What this means for brands: Consistency is key to breaking through the noise. A regular posting schedule ensures your brand stays visible in this fast-moving world of content.
Generate perfect X posts (tweets) with SocialBu’s Free Tweet Generator
15. 10% of Users Are Responsible for 92% of All U.S. Tweets
According to a Research study, a small group of power users drives the vast majority of Twitter conversations. In the U.S., the top 10% of users account for 92% of all tweets, underscoring the significant influence of a highly active user segment.
What this means for brands: Identify and engage with the power users in your niche. Building relationships with these influential accounts can significantly amplify your message.
16. The Average Number of Impressions Per X Post is 2,121
The average post received 2,121.13 impressions in 2024, a significant jump from 1,206.55 in 2023. This suggests that algorithmic changes are increasing the visibility of individual posts.
What this means for brands: Your potential reach per post is growing. Focus on creating high-quality, relevant content that the algorithm is more likely to surface to a broader audience.
17. Users Watched 8.3 Billion Videos Every Day on X in 2024
Video consumption on X is exploding, with users watching 8.3 billion videos daily. This is a 40% year-over-year increase. Furthermore, tweets with video receive 10 times more engagement than text-only posts.
What this means for brands: A video-first strategy is no longer optional on X. Prioritize short-form videos to capture attention and drive significantly higher engagement.
18. The Average Engagement Rate on X for 2026 is 0.015%
The average engagement rate on X decreased in 2026 to 0.015% from 0.029% in 2024. This is a sign to measure your own performance.
What this means for brands: Track your engagement rate (likes, replies, reposts, clicks divided by impressions). If you want to beat this benchmark, your content strategy needs to be on the right track.
19. The Best Time to Post on X is Monday: 9:00 AM – 11:00 AM
Monday mornings between 9 AM and 11 AM are the best time to post on Twitter (X). This is when users are catching up on news and settling into their routines. A common high-attention time window is Monday mornings. But your best time depends on your audience. Use your analytics to confirm.
What this means for brands: Schedule your most important content during these peak windows to maximize visibility and interaction
X (Twitter) Statistics for Marketing and Advertising Performance
For social media marketers, the ultimate goal is to drive business results. These statistics encompass everything from ad revenue and reach to return on investment, demonstrating the effectiveness of X as an advertising platform.
20. Only 32% of B2B Marketers Use X (Twitter)
Only about 32% of B2B marketers include X (Twitter) in their social media marketing strategy. It is significantly lower than adoption rates for more professional or visual platforms like LinkedIn and Instagram.
What this means for brands: If you’re a B2B company, prioritize LinkedIn and Instagram for lead generation, thought leadership, and networking. But you can consider using X selectively for real-time updates and industry conversations.
21. X’s Ads Reached Over 586 Million Users
X’s potential advertising reach remains massive. Its ad products reached 586 million users, providing advertisers with a vast audience.
What this means for brands: Despite narrative shifts, X’s ad platform continues to deliver enormous scale. It’s a powerful tool for top-of-funnel awareness campaigns.
22. People Spend 26% Longer Viewing Ads on X
According to X’s internal data, users spend 26% more time viewing ads on X compared to other leading social platforms. This suggests a less intrusive ad experience, with users more receptive to brand messages.
What this means for brands: You have a slightly longer window to capture attention. Utilize compelling visuals and clear messaging in your ads to maximize the benefits of this extended viewing time.
23. The Average Click-Through Rate (CTR) for X Ads is 0.86%
X ads outperform several competitors with an average CTR of 0.86%. This is higher than the ad benchmarks for both LinkedIn and YouTube, indicating strong user intent and responsiveness.
What this means for brands: The audience on X is primed to click. Ensure your ad copy has a strong call to action and points to a relevant, high-quality landing page to capitalize on it.
24. X Delivers an Average ROI of $2.70 for Every $1 Spent
Twitter advertising delivers a 40% higher ROI than other media channels, with an average return of $2.70 per dollar spent.
What this means for brands: When executed well, X advertising is highly profitable. Track your campaigns closely to optimize for conversions and maximize your return on investment.
25. X Will Account for 0.2% of Digital Ad Spend
Data shows X capturing 0.2% of the total digital ad spend. This niche position reflects its specialized role in advertising, focusing on real-time and conversational marketing.
What this means for brands: X advertising must be part of a diversified media mix, used strategically to achieve specific goals, such as event promotion, product launches, and brand announcements.
26. Only 5.5% of Marketers Use X for Influencer Campaigns
Compared to platforms like Instagram and TikTok, X is a less saturated channel for influencer marketing. Only 5.5% of marketers use it for campaigns.
What this means for brands: This presents a massive opportunity for you. Partner with credible, niche-specific influencers on X to help your brand stand out and reach a highly engaged audience with less competition.
How to Leverage Niche Creators on X
Even with low overall use, you can win by focusing on micro-influencers and industry experts. Look for accounts with high engagement rates, not high follower counts. Sponsor a thread, co-host a live audio Space, or have them share an authentic product review. The trust they’ve built with their audience is your most valuable asset.
Put These X (Twitter) Statistics into Action
Data is only valid when you act on it. Knowing these statistics is the first step, but using them to build a smarter, more effective X strategy is what will truly drive results for your business.
With a powerful social media scheduling and management tool like SocialBu, you can turn these insights into a streamlined workflow.
Here is how SocialBu helps you:
- Schedule and post content strategically: Schedule your content to post during peak engagement hours and keep your content calendar full with the Tweet Generator.
- Measure performance and prove ROI: Go beyond vanity metrics. Track your analytics like engagement rates, impressions, and follower growth to understand what’s working and report on your success.
- Build conversations with a unified social inbox: Manage your replies, mentions, and DMs in one unified social media inbox to ensure you never miss an opportunity to engage with your audience.
Ready to take control of your X strategy?
Turn X Insights into Results
Twitter (X) Statistics: FAQs
How many active users are on Twitter in 2026?
In 2026, X (formerly Twitter) has over 611 million monthly active users and approximately 245 million monetizable daily active users, making it a central global social platform.
What age group uses Twitter the most?
The largest age demographic on X is young adults. In the U.S., 38% of adults aged 18-29 use the platform, making it a key channel for reaching Gen Z and Millennials.
How effective are Twitter ads in 2026?
Twitter ads remain highly effective for specific goals. They boast an average click-through rate of 0.86% (higher than LinkedIn and YouTube) and deliver an average ROI of $2.70 per $1 spent.
Has Twitter grown or declined in 2026?
The platform has seen fluctuations, but its overall user base remains stable with over 611 million monthly users. Key metrics, such as video views and post impressions, have actually seen significant year-over-year growth.
What are Twitter Blue (X Premium) subscriber numbers?
As of early 2026, there are approximately 1.4 million X Premium subscribers/users. This subscription service offers users enhanced features like the ability to edit posts and prioritized visibility.
Is Twitter still relevant for marketers?
Yes. With a massive, highly engaged daily user base, powerful advertising tools, and a central role in news and culture, X remains a vital platform for brand awareness, real-time marketing, customer service, and B2B content distribution.