In 2026, getting likes and comments isn’t enough. What really matters is the difference your content makes. Social media success today means creating posts that lead to real results like more customers, more sales, or stronger communities. It’s not just about being seen; it’s about making something happen.
Social Media ROI (Return on Investment) is the definitive metric for evaluating how effectively your social strategies drive revenue, leads, and customer loyalty. Simply put, it quantifies the returns generated from your social media efforts, like paid ads, content creation, and community management, against the costs involved.
Why focus on ROI now?
The digital landscape is increasingly competitive, and marketers face pressure to prove value. Without clear benchmarks, even viral campaigns can become financial black holes. This blog post will provide insights, including social media benchmarks by industry 2026, proven formulas, and strategies to align your goals with measurable outcomes.
What is Social Media ROI?
Social media ROI benchmarks are strategic tools. Knowing your sector’s average social media marketing ROI statistics (e.g., 250% for e-commerce vs. 120% for healthcare) helps set realistic targets. They also empower teams to optimize budgets, prioritize high-performing platforms, and demonstrate value to stakeholders in a data-driven era.
ROI transforms social media from an abstract activity into a results-driven discipline. Let’s explore its core principles.
Definition and Key Concepts
Social Media ROI measures the money you make from social media efforts compared to your spending. But not all likes, followers, or views actually translate to real business gains:
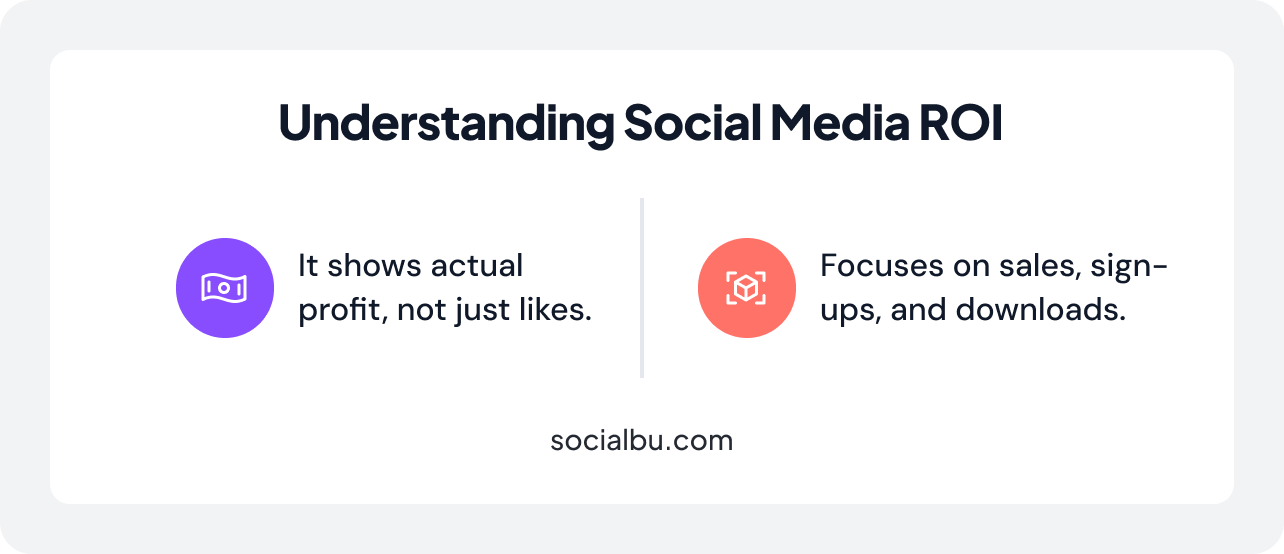
- Direct revenue metrics track tangible outcomes, such as sales from Instagram Shops, webinar sign-ups via LinkedIn, or app downloads driven by TikTok ads.
- Vanity metrics, such as likes and follower counts, may indicate visibility but often lack correlation to revenue. For example, a viral Reel with 500K views holds little value if it doesn’t convert viewers into customers.
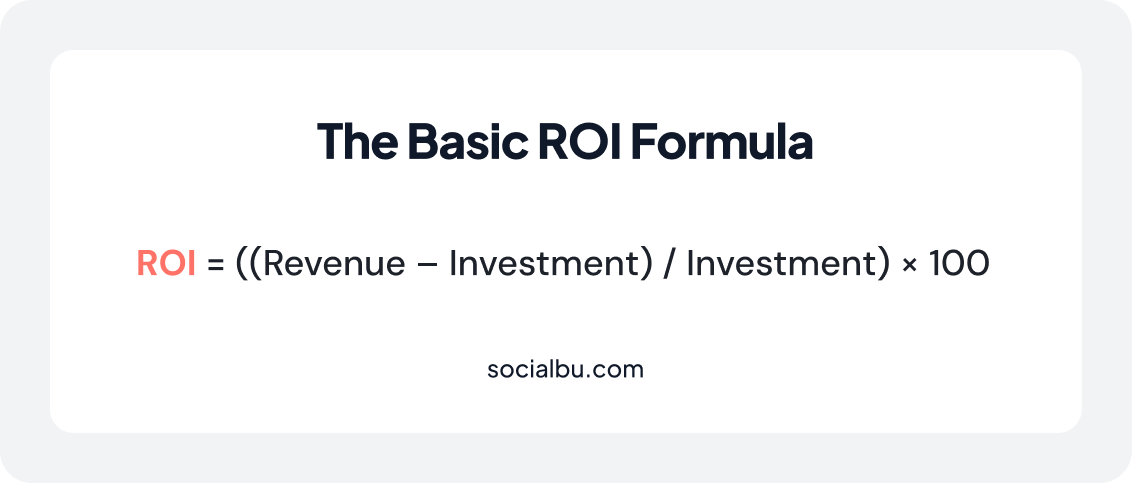
The Basic ROI Formula
The social media ROI formula is a basis of performance analysis:
Investment
It includes all expenses like
- Ad spend (1,500/month)
- Agency fees (3,000)
- Tools like SocialBu ($99/month)
- Team labor (20 hours/week)
Revenue
Connect your earnings to specific campaigns. For example:
- If you ran a Facebook promo, you made $10,000 from it.
- If you posted a YouTube tutorial, it brought in 200 new leads.
In simple terms, know which post or ad brought you money or new customers.
Practical Example of a SaaS Company Investment
A SaaS company spends $5,000 on LinkedIn ads and content. As a result, 50 people sign up for their software, each paying $200 monthly.
So, the company earns:
- 50 sign-ups × $200 = $10,000 in monthly revenue.
Now, let’s calculate the return on investment (ROI):
- They spent $5,000 and made $10,000. That’s a profit of $5,000.
- ROI = (Profit / Cost) × 100
- ROI = ($5,000 / $5,000) × 100 = 100%
In simple words:
They doubled their money, so they got a 100% return on their investment.
Measurement Challenges
By 2026, two critical hurdles complicate ROI tracking:
- Non-monetary value: Sometimes, social media helps in other ways, like more people knowing your brand or talking about it in a positive way. For example, if positive mentions on Twitter go up by 30%, that’s a win, even if it’s hard to put a dollar amount on it.
- Fragmented customer journeys: Someone might see your brand on TikTok, then search for you on Google, and finally buy after getting an email. Most tools track these steps separately, so it’s hard to see the whole picture. That’s why you need tools that can connect all these steps and show the real impact of your social media efforts.
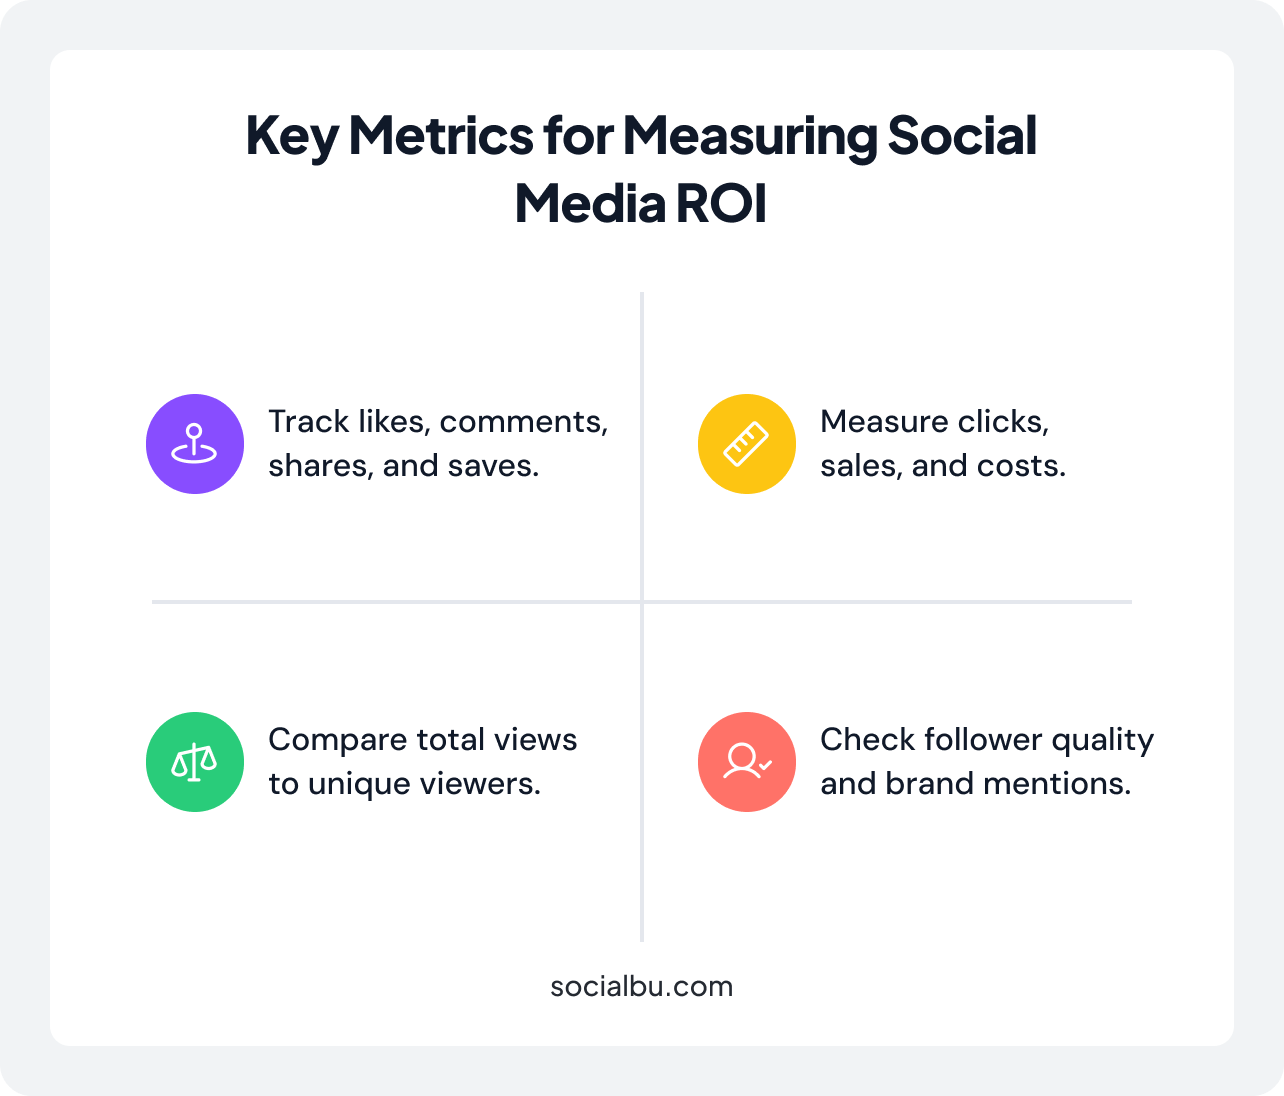
Key Metrics for Measuring Social Media ROI
To measure social media ROI, you need to track the right metrics. Think of these as your compass. They tell you whether your posts drive real value or just take up space online. For quick reference, you can get help from the social media ROI benchmarks calculator available online to compare your CTRs and conversion rates against industry norms.
Let’s break down the numbers that matter.
1. Engagement Metrics
Likes, comments, shares, and saves show how people interact with your content. But don’t stop there. Calculate your engagement rate to see the bigger picture. For example:
If a post gets 1,000 likes and 50 comments with 10,000 followers, your engagement rate is:
(Total Engagements / Followers) × 100 = (1,050 / 10,000) × 100 = 10.5%
A bakery might celebrate a 12% engagement rate on Instagram Reels, but if those likes don’t lead to orders, it’s just digital applause.
2. Reach and Impressions
Impressions indicate how many times your content is seen. If a LinkedIn post is shown repeatedly to the same users, it might reach 5,000 impressions.
Reach indicates the unique viewers who actually saw it. For example, a TikTok video with 50,000 reach means 50,000 distinct users scrolled past it.
A fitness influencer’s post could have 100,000 impressions but only 30,000 reach, meaning some viewers saw it multiple times.
3. Conversion Metrics
This is where ROI gets real:
- Click-Through Rate (CTR): If 500 people click your “Shop Now” link out of 10,000 impressions, your CTR is 5%.
- Conversion Rate: If 50 of those clicks turn into sales, your conversion rate = 10%.
- Cost per Conversion: Spending 1,000 on Instagram ads for 50 sales? Cost per conversion = 20.
Tools like UTM parameters help track this. For example, adding ?utm_source=tiktok to a link lets you see if a customer came from TikTok.
4. Follower Growth and Brand Sentiment
Growing your follower count is exciting, but who follows you matters more than the number. At the same time, how people talk about your brand, whether they’re raving fans or frustrated critics, shapes your reputation and long-term ROI. Together, these metrics reveal whether your audience is truly invested in what you offer.
Follower Growth
A 10% monthly increase in followers is great, but check if they’re real people. A B2B brand might prioritize LinkedIn followers who list “CEO” in their bios over random accounts.
Brand Mentions
If your brand is tagged 200 times this month versus 100 last month, that’s a 100% increase in visibility.
Sentiment Analysis
Use tools to categorize mentions as positive, neutral, or negative. For example, a skincare brand might find 70% of comments like “This serum changed my skin!” vs. 10% saying “Broke me out.”
Social Media ROI Benchmarks by Industry
ROI changes based on your goals, industry, and context. There isn’t a single formula that fits every situation. What works for a fashion brand might flop for a hospital. Let’s explore some social media ROI benchmark examples for 2026 that illustrate the range you can expect.
Industry Variability
- E-commerce: High ROI (250-400%) thanks to direct sales via Instagram Shops or TikTok ads.
- B2B: Lower ROI (80-150%) but longer customer lifetime value. LinkedIn whitepaper downloads might take months to convert.
- Healthcare: ROI around 100-250%, focusing on trust-building through educational posts.
- Retail: ROI varies by platform. Pinterest drives 200% ROI for home decor brands, while Twitter lags in this scenario.
Recent Benchmark Data and Examples
Let’s break down real social media ROI examples by industry in 2026, from TikTok’s explosive ROI to Instagram’s evolving role in e-commerce, so you can see where your efforts stack up.
- TikTok: 78% of small‑to‑medium e‑commerce brands report higher ROI on TikTok Shop than Instagram or Facebook, with 2.5% engagement rates.
- Instagram: Engagement rates dropped to 0.5% in 2026 as Reels face TikTok competition, but shoppable posts still drive 29% of e-commerce sales.
- LinkedIn: B2B campaigns see 0.44–0.65% CTRs, but each lead is worth 5x more than on other platforms.
Application of Benchmarks
Marketers use these numbers to:
- Set Goals: A healthcare brand aiming for 5% engagement (vs. the industry’s 3% average) knows it’s pushing boundaries.
- Optimize Budgets: After reviewing benchmarks, a retailer might shift from Facebook (150% ROI) to TikTok (300% ROI).
- Tailor Content: A B2B SaaS company uses LinkedIn’s 0.44–0.65% average CTR to design stand-out CTAs.
Strategies to Improve Social Media ROI
Improving ROI does not depend on luck. It depends on your strategy. Whether you’re aiming for higher sales or stronger brand loyalty, the following steps turn guesswork into measurable growth.
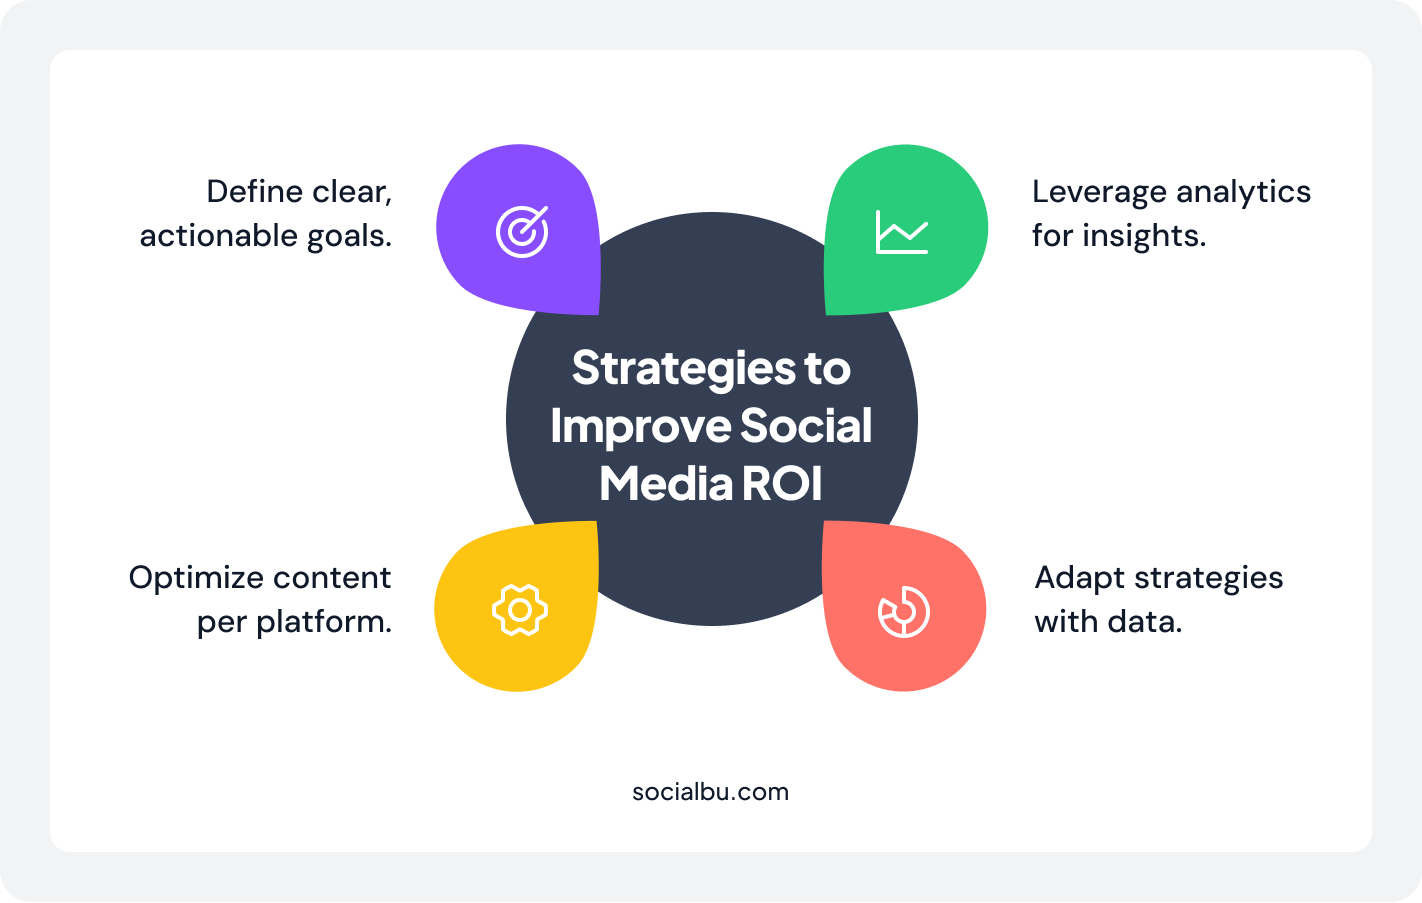
1. Setting Clear Goals and KPIs
Start with SMART goals: Specific, Measurable, Achievable, Relevant, and Time-bound. For example:
- Increase conversions: Boost Instagram Shop sales by 20% in Q3 using Reels and Stories.
- Boost brand awareness: Grow LinkedIn followers by 15% in 6 months through weekly thought leadership posts.
A local bakery might set a goal like “Drive 50 new email sign-ups monthly via TikTok recipe tutorials,” linking their efforts directly to ROI.
2. Content and Campaign Optimization
You can customize your content according to each platform’s audience:
- Instagram Reels thrive on quick, visually striking tutorials.
- LinkedIn articles perform better with data-driven insights.
- Test variations with A/B testing. Run two versions of a Facebook ad (different headlines or images) to see which drives more clicks. Partner with micro-influencers (5K–50K followers) for authentic reach. A skincare brand might see 3x higher ROI with nano-influencers versus celebrities.
3. Leveraging Analytics Tools
Combine native tools (like Instagram’s Reach and Impressions data) with platforms like SocialBu for deeper insights. For example:
- Use Google Analytics to track if Pinterest traffic converts to sales.
- Hootsuite’s sentiment analysis can flag negative trends before they escalate.
A fitness app might discover that YouTube tutorials have a 5% CTR, while Twitter links only hit 1%, prompting a reallocation of resources.
4. Iterative Strategy Adjustment
Review metrics weekly, not quarterly. If a TikTok campaign has a 2% CTR (below the industry benchmarks for social media engagement), tweak the call-to-action or posting time.
Monitor your competitors continuously. A fashion retailer might notice their rivals succeeding with TikTok LIVE sales and replicate the tactic.
You can also use a social media ROI calculator from third-party providers, such as Vaizle’s interactive spreadsheet, to plug in your ad spend, conversion rates, and content costs, then forecast your expected returns before launching a campaign. Now, let’s see how SocialBu combines all these strategies and turns insights into action with one powerful platform.
How SocialBu Can Help Achieve Social Media ROI Benchmarks
SocialBu is an all‑in‑one social media management and automation tool that centralizes scheduling, analytics, reporting, competitor insights, and team workflows in a single dashboard. Whether you’re a solo creator or running a multi‑brand agency, SocialBu streamlines every step so you spend less time toggling apps and more time driving real results.
Here’s how SocialBu’s features map to your ROI benchmarks, helping you hit your targets with clarity and efficiency.
Before we dive in, remember: you’ve already set your ROI goals (e.g., a 10% lift in conversions or a 20% boost in engagement). SocialBu doesn’t spit out benchmarks for you. Instead, it gives you the tools to track, analyze, and optimize every step toward those goals in one place.
Key Features and Benefits
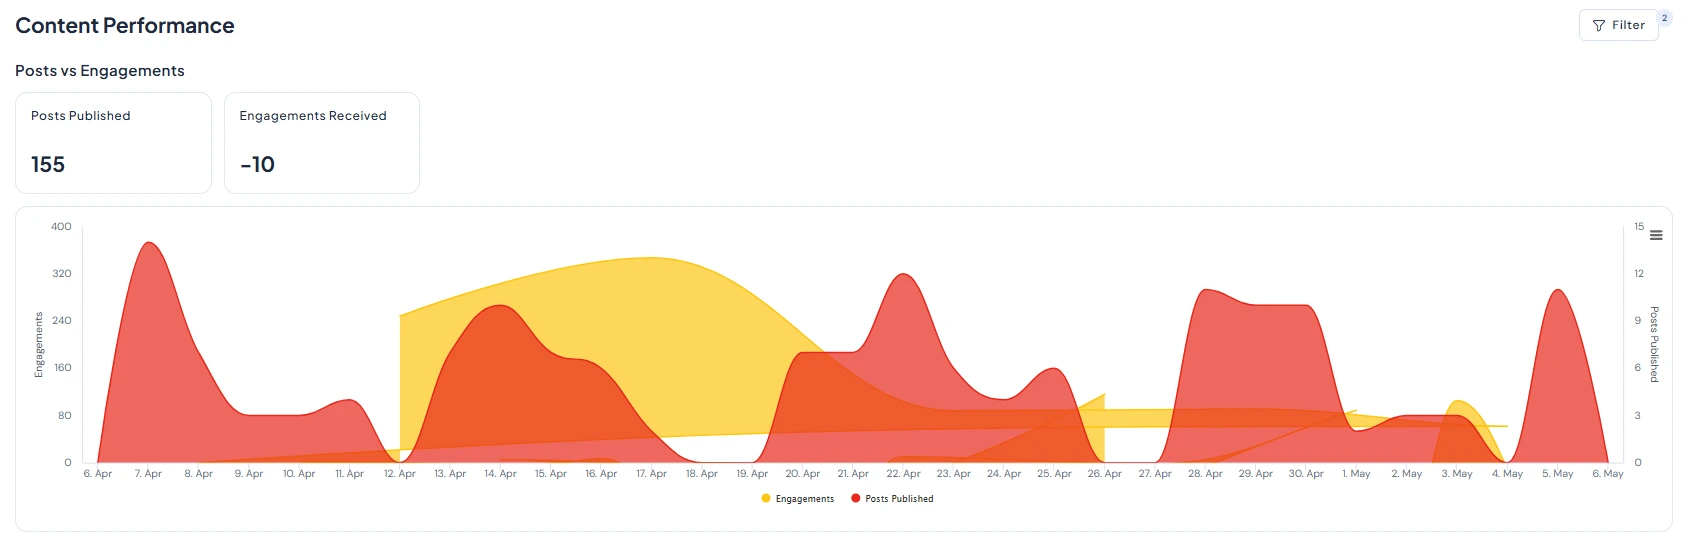
SocialBu’s feature set is built to align directly with the ROI benchmarks you’ve defined, giving you real‑time data, powerful automations, and seamless collaboration so you can hit your targets consistently. Each module, from analytics to publishing, helps you measure progress against specific KPIs (engagement rate, reach, conversions) and refine your tactics.
Integrated Analytics Dashboard
- Aggregate metrics from all channels (Facebook, Instagram, LinkedIn, Twitter, TikTok, etc.) into one view.
- Customizable widgets to track your specific ROI targets (e.g., engagement rate vs. an 8% goal).
- Real‑time alerts for performance dips or spikes to surface issues and opportunities instantly.
Advanced Reporting Tools
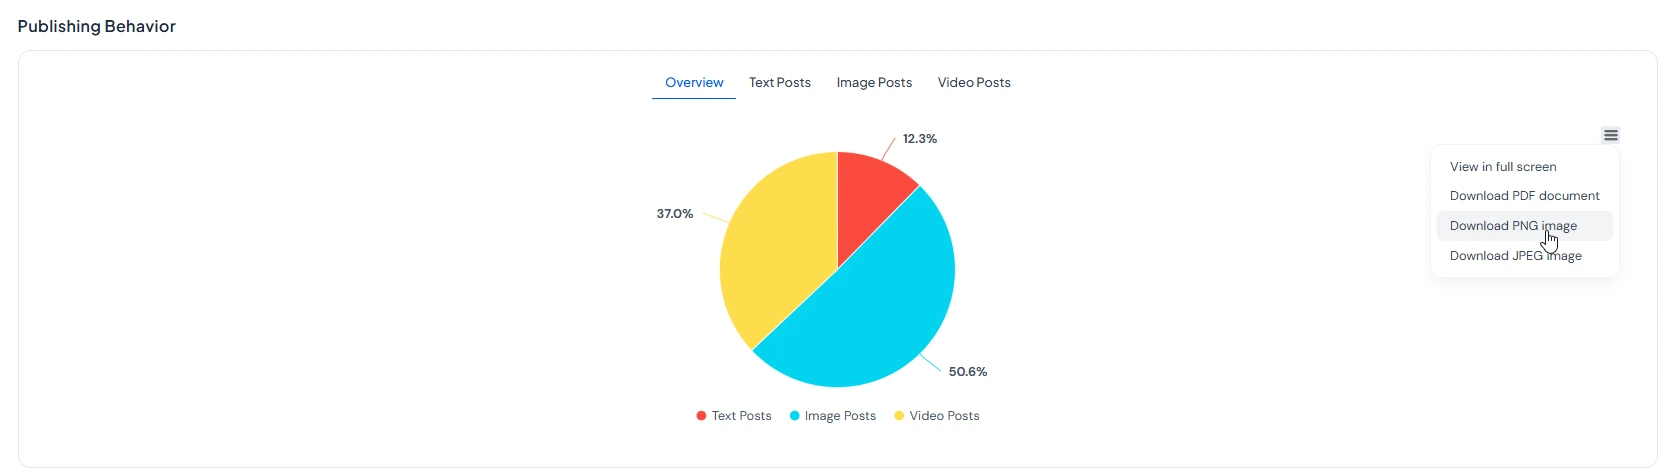
- Build fully customizable reports with clear charts and graphs.
- Tie reports to any timeline (weekly, monthly, quarterly) to match your ROI review cadence.
- Export options in PDF or CSV for easy sharing with stakeholders and integration into presentations.
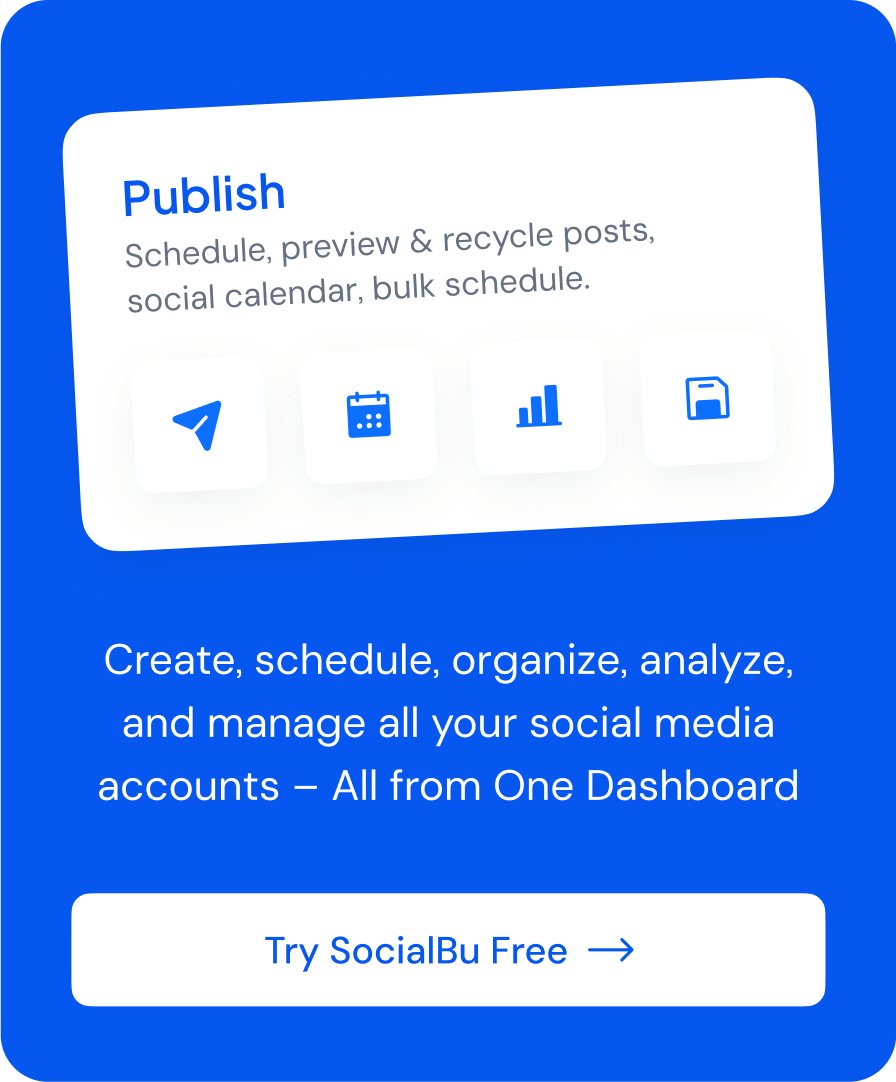
Content Scheduling and Optimization
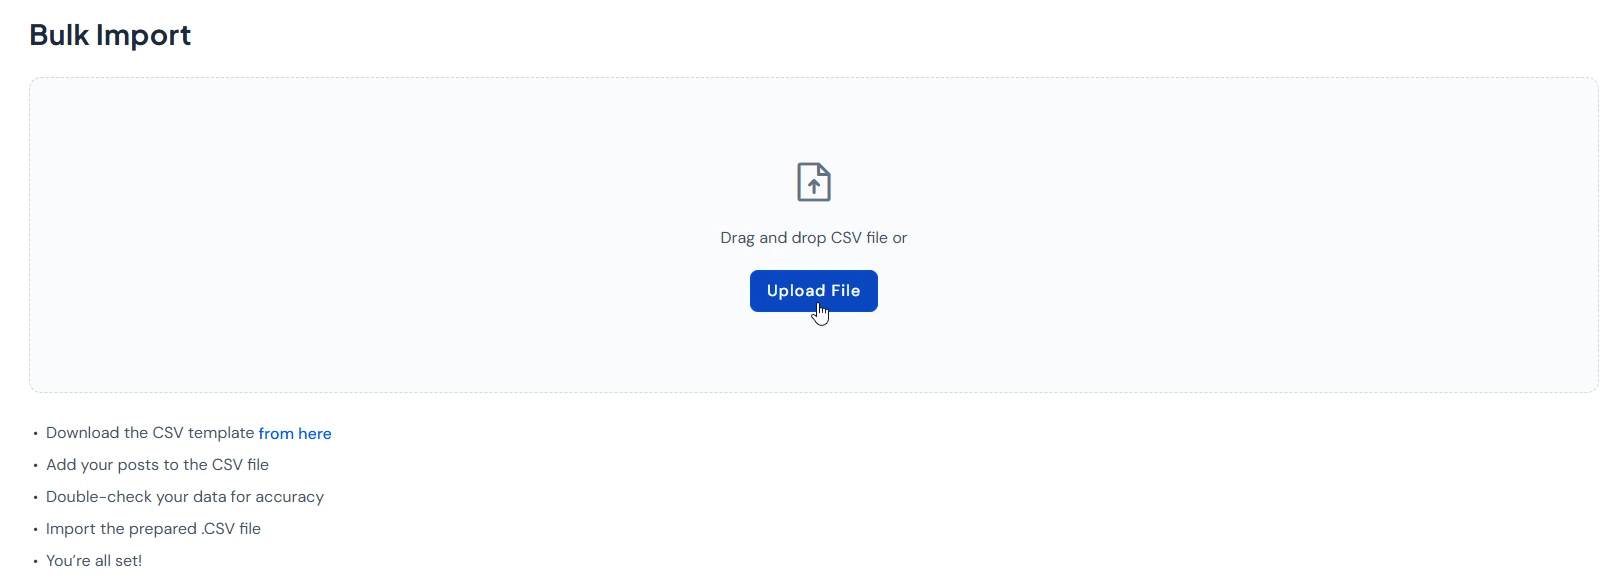
- One‑click bulk uploads (CSV) for rapid content queuing across profiles.
- Auto‑schedule posts at your chosen optimal times without manual effort.
- Rule‑based automations (e.g., “repost any link post that hits 500 engagements”) to keep top content cycling on autopilot.
Competitor Benchmarking via Monitoring
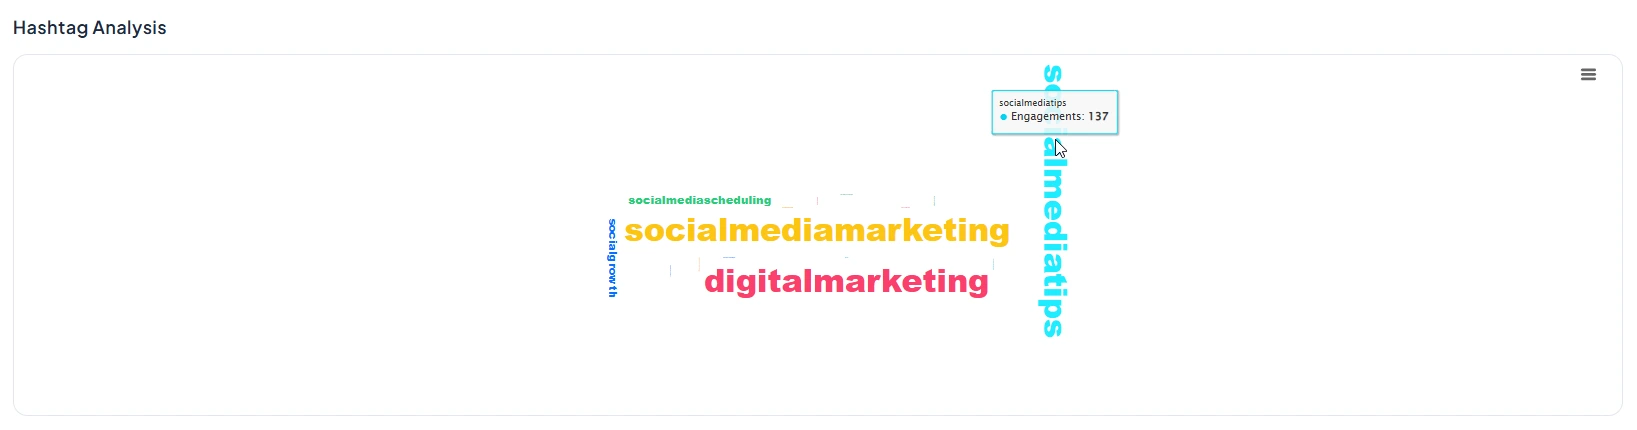
- Track competitor keywords, hashtags, and mentions alongside your brand data.
- Leverage built‑in monitoring streams to spot competitors’ high‑performing content.
- Use combined analytics reports to conduct side‑by‑side performance comparisons.
Team Collaboration & Workflow Management
- Role‑based access controls allow creators, reviewers, and publishers to work securely without shared passwords.
- Custom approval workflows (e.g., “Needs Review → Approved → Scheduled”) to enforce brand guidelines.
- In‑platform draft, comment, and approval features for seamless handoffs.
With tools that simplify teamwork and highlight what truly matters, SocialBu turns effort into measurable results. This shift lets you focus less on chasing likes and more on actions that grow your business.
Conclusion
Measuring social media ROI benchmarks becomes inevitable when your channels mature, budgets grow, and stakeholders demand accountability. Organizations can transform social media from a vanity metric machine into a predictable growth engine through SMART goals, industry benchmarks, flexible strategies, and deep analytics.
A strong ROI framework blends engagement and conversion metrics, iterative A/B tests, micro‑influencer collaborations, and weekly performance reviews. This dynamic approach ensures continuous improvement and keeps strategies responsive to evolving trends.
So, are you ready to turn your ROI benchmarks into real‑world results?
Start your free 7‑day trial of SocialBu today. Connect your accounts, build custom dashboards, and see how streamlined workflows help you hit your social media ROI targets faster.
FAQs
What is a good ROI for social media?
A good ROI varies by industry. E-commerce campaigns often achieve around 250% ROI, while the healthcare and education sectors may see returns between 50% and 100%.
What is the average ROI on social media?
There’s no universal average, but e-commerce campaigns often hit 250%, while healthcare or education sectors may see 50-100%. Always compare to industry benchmarks for social media engagement.
What is the 50/30/20 rule for social media?
It’s a budgeting guideline. 50% of posts to audience engagement, 30% to brand-related content, and 20% to promotional material.
What is the 5-5-5 social media strategy?
It’s a framework that recommends five posts weekly to educate or entertain, five to promote your brand, and five to engage with followers.
Is 10% ROI realistic?
Yes, for branding campaigns (e.g., awareness or sentiment). However, 10% is low for direct sales-focused efforts. You should aim higher.
Is 80% ROI good?
Yes! In industries like healthcare or SaaS, 80% is strong. Compare it to your social media benchmarks by industry 2026 to see how well you’re doing.