Clients are not looking for more dashboards. They want answers. Is performance improving or not? What changed? What should we do next?
This guide will show you how to build social media analytics reports that are actually read, not ignored.
Why Clients Ignore Most Social Media Reports?
Most social media reports look impressive at first glance. Charts, numbers, graphs, and tables everywhere. But the problem is, none of it explains what it means.
A report fails when it does not answer basic questions like:
- What happened this month?
- Why did it happen?
- What should we change next?
Without these answers, even a detailed report becomes background noise.
Data without meaning is useless
Many teams believe more data means better reporting. That is not true.
Research supports this approach: the study Towards Understanding How Readers Integrate Charts and Captions found that captions and contextual text help readers interpret charts more accurately.
This makes sense. Numbers do not speak for themselves. People need context.
For example:
- Engagement increased by 10 percent
This is data - Engagement increased because short video posts were added twice a week
This is insight
Clients care about the second one. A good social media analytics report template removes friction. It simplifies everything into: What worked? What did not? What should change?
That is it. No confusion. No extra thinking required.
Real-World Example: Why ‘Data Without Insight’ Fails?
To understand this problem in practice, here’s a snapshot from a real product analytics system over the last 90 days. The Analyze feature shows strong usage and highlights exactly why raw data alone is not enough.
90-day Overview:
- 5,132 total pageviews
- 1,169 unique users
- 4.4 average Analyze pages visited per user
At first glance, this looks like healthy engagement. But without context, it’s unclear what it means.
For example:
- Are users finding what they need quickly, or are they navigating too much?
- Which parts of the product are actually valuable?
Sub-page breakdown
Page | Page views | Unique users |
Content performance | 1901 | 643 |
Analyze | 1365 | 482 |
Account performance | 1202 | 531 |
Network performance | 397 | 242 |
Team performance | 267 | 177 |
This breakdown immediately reveals something important:
- Content performance is the most visited section, showing users are primarily focused on content-level insights.
- Team performance has the lowest reach, suggesting either low relevance or discoverability issues.
But again, this is still just data unless we interpret it.
What Does this Example Prove?
Even when analytics are rich, they still don’t answer:
- Why did usage peak in May?
- Why did it drop afterward?
- What action should be taken?
This is exactly why social media reports must go beyond dashboards. Without interpretation, even strong analytics lose their value.
How to Create a Social Media Report Template?
When creating a social media report template, follow a simple flow that anyone can understand in under two minutes.
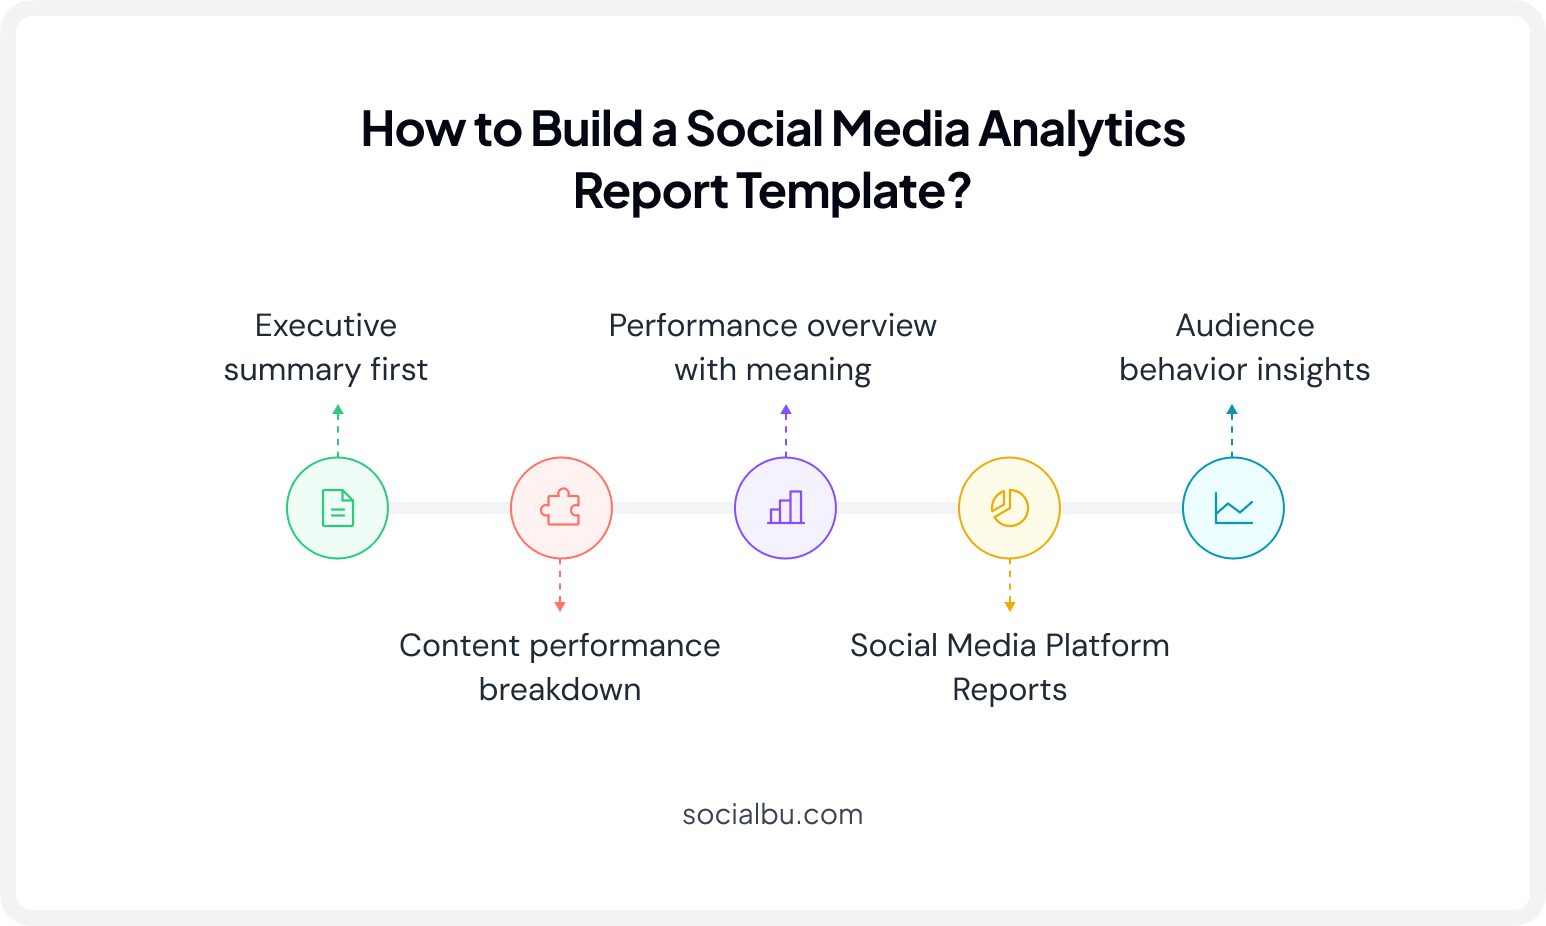
1. Executive Summary First
The executive summary is the most important section of your social media analytics report. Keep it short. Four to five lines maximum. No charts. No tables.
Include:
One win from the month. One problem or drop. One reason behind it. One clear action for next month.
Example:
This month, reach and impressions increased due to consistent posting of short-form videos. The engagement rate dropped slightly because fewer carousel posts were published. Next month, we’ll return to a balanced content mix to improve engagement and overall conversion tracking.
That is enough. No extra detail needed here.
2. Performance overview with meaning
This section is the core of your social media metrics report. Present only the most important social media KPIs, including only key metrics: Reach and impressions, engagement rate, website clicks, and follower growth.
But every metric must include a one-line explanation.
Example:
Engagement rate dropped slightly this month. This is linked to fewer interactive posts and more static content.
Without explanation, metrics are incomplete.
3. Content performance breakdown
This section explains what content actually worked. Instead of simply listing your top-performing posts, explain why they succeeded.
- What was the post about?
- Why did it perform well?
- What format was used? (Reel, Carousel, Story, Image, etc.)
- What timing or hook helped?
Example:
A behind-the-scenes reel performed best because it felt personal and was posted during peak evening hours. It created a stronger emotional connection compared to product posts.
This is where learning happens. A strong social media analytics report template always turns content into lessons.
4. Audience Behavior Insights
This section is often overlooked in social media reporting, yet it provides some of the most valuable marketing analytics for future planning.
Look at: When do people engage most? What type of content gets saved? What causes drop-offs?
Example:
Audience engagement is higher on weekday evenings. Educational content gets more saves than promotional posts.
These audience insights strengthen your social media analytics dashboard and help improve future campaign performance, performance tracking, and overall social media ROI.
5. Social Media Platform Reports
If you manage more than one platform, include a separate section for each one in your social media analytics report template. Every platform has different goals and audience behavior, so combining all the data can hide important insights.
For each platform, include: reach and impressions, engagement rate, follower growth, top-performing posts, and one key insight.
Example:
- Instagram: Reels generated the highest engagement and follower growth.
- Facebook: Educational posts received the most shares and website clicks.
- LinkedIn: Industry tips attracted more comments and profile visits.
Breaking down your social media report by platform makes it easier to compare results and improve cross-platform analytics.
Build Your Social Media Report with SocialBu Analytics
Creating a report from scratch can take hours. SocialBu Analytics Insights simplifies the process by collecting your social media data in one place and turning it into easy-to-understand reports.
Here’s how you can build your report step by step.
Step 1: Connect your social media accounts to SocialBu. You can track platforms like Facebook, Instagram, LinkedIn, X (Twitter), TikTok, and more from one dashboard.
Step 2: Open the Analyze section to view your latest performance. You’ll find key metrics like reach, impressions, engagement rate, follower growth, and engagement per post, all already organized for you.
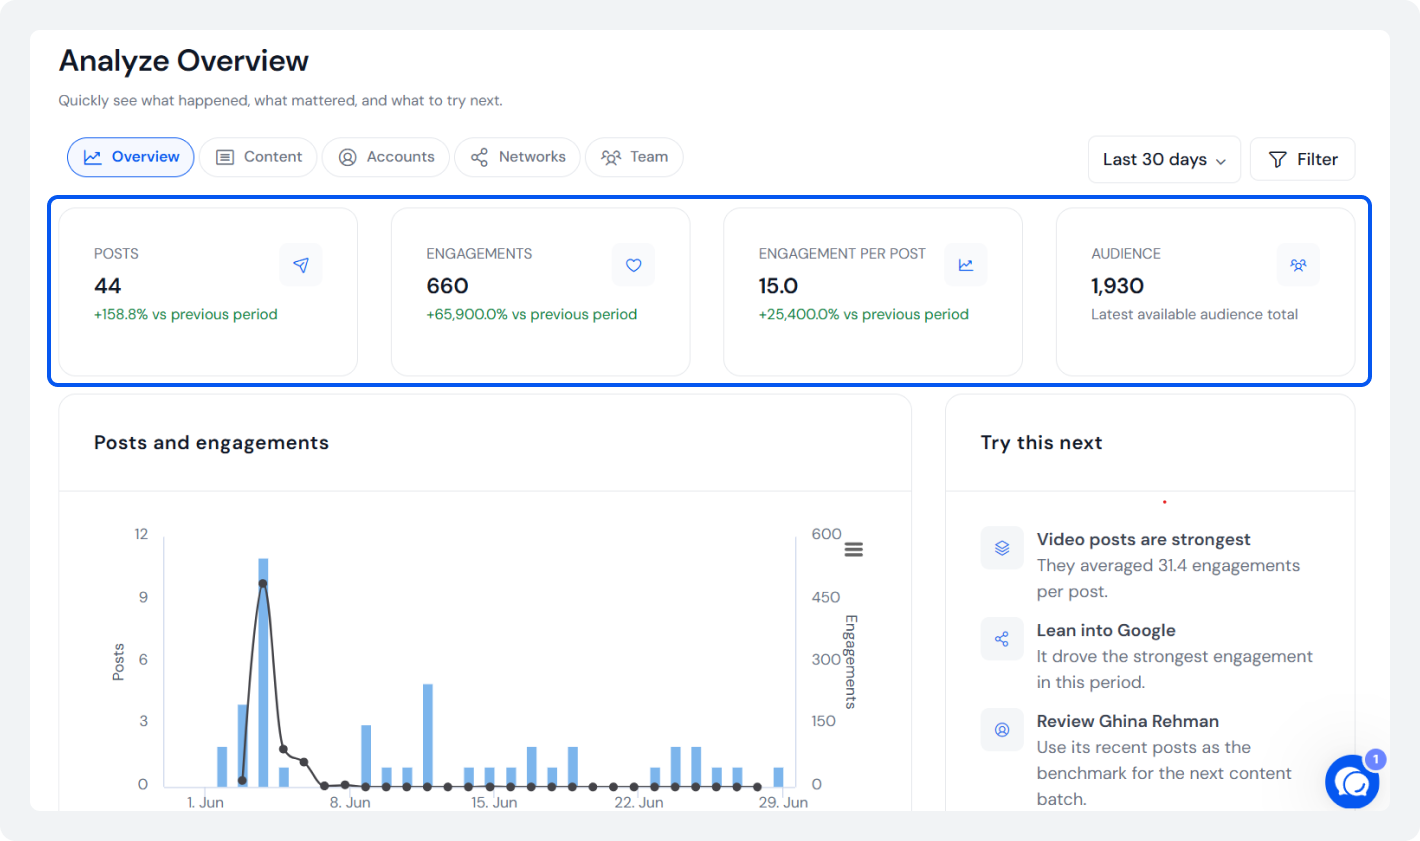
Use these insights to write your executive summary.
Step 3: Check which type of post, i.e., Text Posts, Image Posts, and Video Posts, received the most engagement, shares, saves, or clicks.
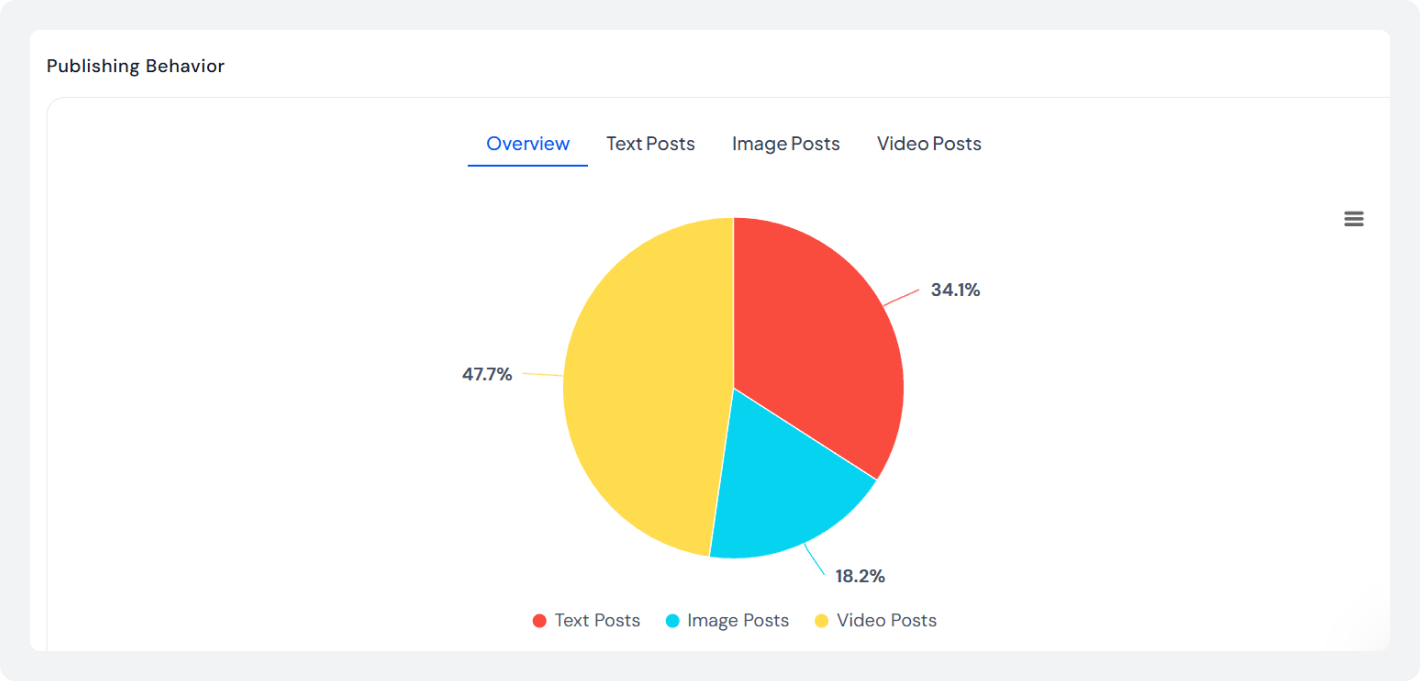
Instead of simply listing your top-performing posts, explain why they worked. Look at the content format, posting time, and audience response to find patterns you can repeat.
Step 4: If you manage multiple accounts, compare each platform separately. Just click on ‘Accounts’ from the top.
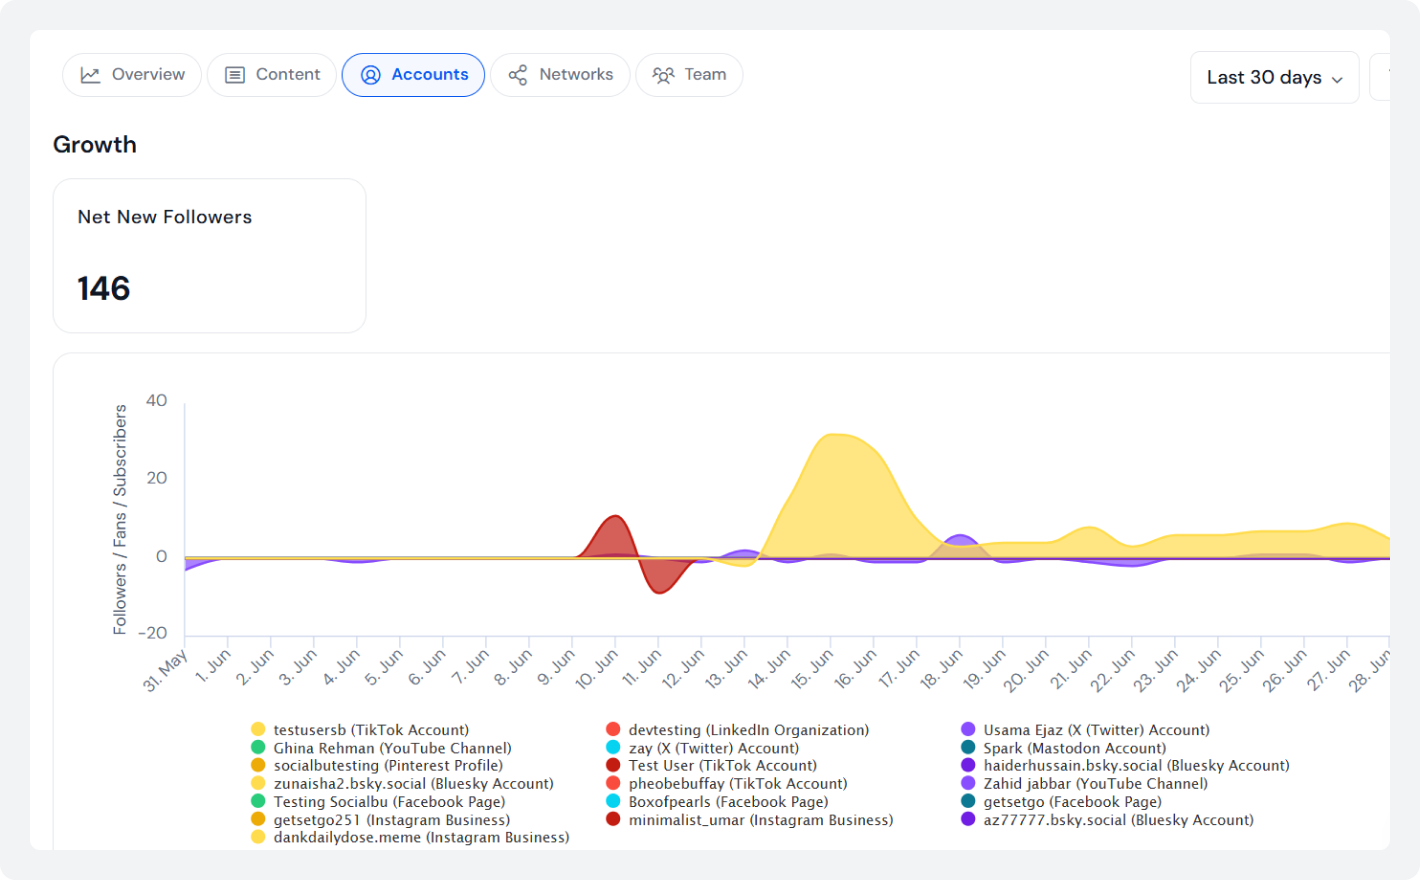
SocialBu analyze feature makes it easier to review Instagram, Facebook, LinkedIn, and other channels without switching between different apps. This helps you create clear platform-wise sections in your social media analytics report template.
Numbers alone are not enough. Use the insights from SocialBu analytics to answer three simple questions:
- What improved?
- What declined?
- What should we do next month?
These recommendations are what clients remember most. Create your weekly, monthly, or quarterly social media report using the latest analytics.
By following these steps, SocialBu analytics helps you spend less time collecting data and more time delivering reports that clients actually read and understand.
Once you’ve built a well-structured social media analytics report template. The next step is to present it in a way clients can quickly understand and act on.
Create Better Social Media Reports with SocialBu
Turn your social media data into clear, client-ready reports with SocialBu Analytics. Track performance across platforms and create reports in minutes, not hours.
How to Present a Social Media Analytics Report Template?
Even the best report fails if it is not easy to read. Presentation matters as much as content.
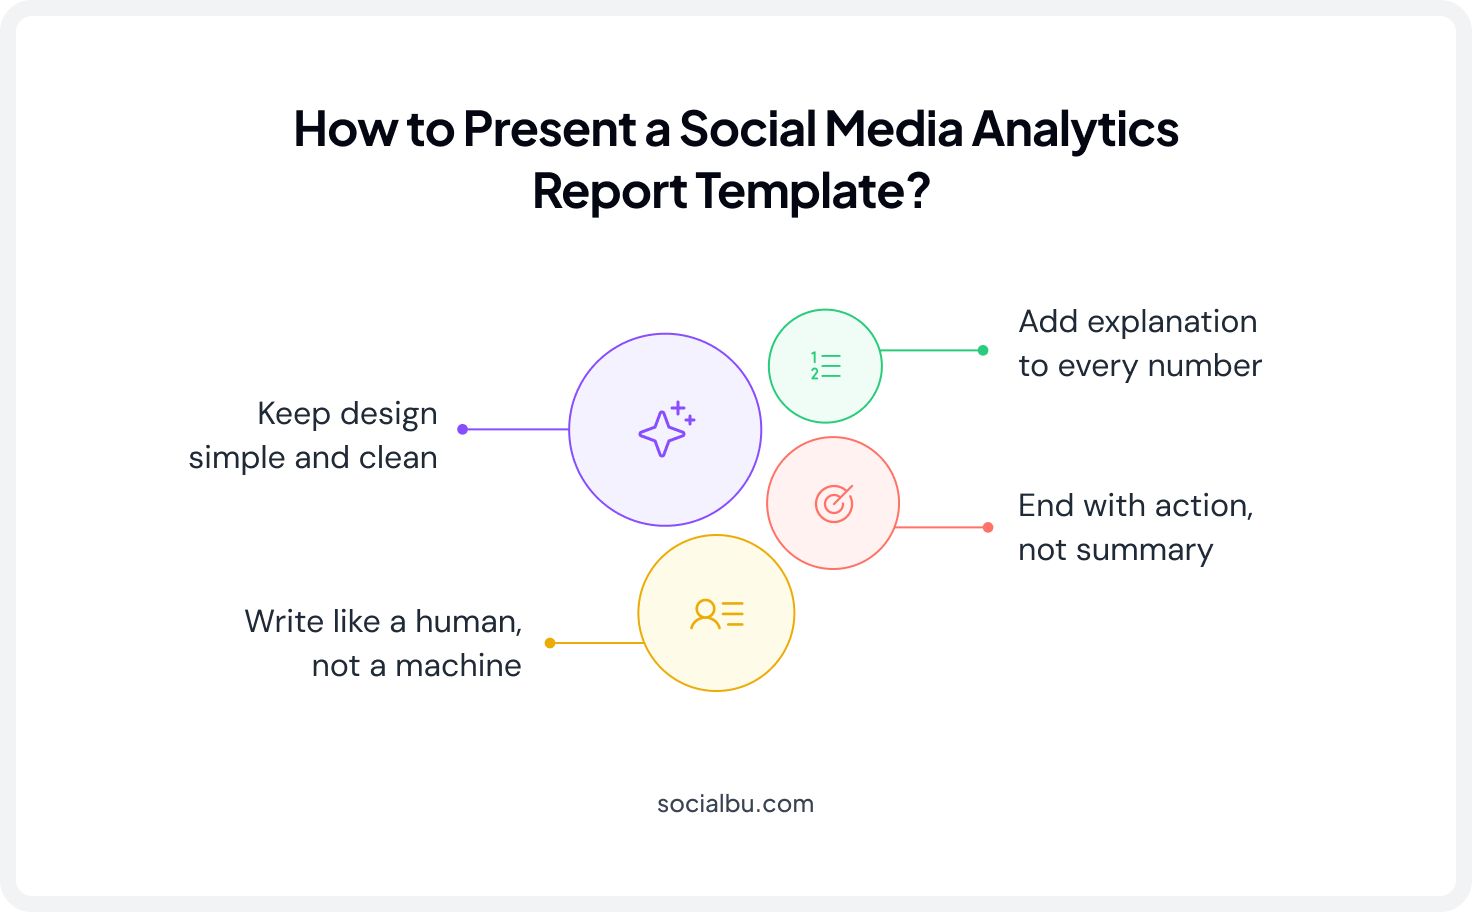
1. Keep design simple and clean
Do not overload reports with visuals. Use simple charts, screenshots of top posts, and clear spacing between sections
One clean chart is better than five confusing ones.
2. Write like a human, not a machine
If your report sounds robotic, it will not be read.
Compare these:
Bad: Engagement metrics showed a decline due to reduced content output.
Better: Engagement dropped because fewer posts were shared this month.
Same meaning. Easier to read. A good social media analytics report template always uses simple language.
3. Add explanation to every number
Never assume data speaks for itself. Always add one line of context.
Example: Reach increased this month because short videos were posted consistently during peak hours.
This small step changes everything.
4. End with action, not summary
Most reports end by repeating what already happened. That is not useful. Instead, end with direction: What will continue? What will change? What will be tested next?
Example:
Next month, the focus will shift to increasing interactive content and testing new posting times during weekends.
This is what clients remember.
How Often Should You Create a Social Media Report?
A well-designed social media analytics report template is only valuable if it is shared consistently. Your reporting schedule should match your goals:
- Weekly reports: Best for active social media campaign reports, paid advertising, product launches, or time-sensitive campaigns. It is useful where performance tracking and conversion tracking require close monitoring.
- Monthly reports: The most common format for social media reporting and client reporting. A monthly report provides enough data for accurate social media data analysis, meaningful social media insights, and informed decision-making.
- Quarterly reports: Ideal for evaluating long-term campaign performance, measuring social media ROI, reviewing social media benchmarking, and analyzing broader marketing analytics trends across multiple campaigns.
No matter how often you report, every social media report should answer three essential questions:
- What happened?
- Why did it happen?
- What should we do next?
A focused social media insights report delivered on a regular schedule will always provide more value.
Conclusion
A strong social media analytics report template is not about showing more data. It is about making data easy to understand and act on.
When clients can quickly see what is working and what needs to change, they trust the process more. They make faster decisions. And they actually read your reports.
Keep it simple. Keep it clear. Focus on meaning, not numbers.
FAQs
Q: What should be included in a social media analytics report?
A social media analytics report should include an executive summary, key social media KPIs, content performance analysis, audience behavior insights, platform-specific results, and clear recommendations for the next reporting period.
Q: How do I create a social media report for clients?
To create a social media report for clients: start with a short executive summary highlighting the biggest win, challenge, reason behind the results, and next steps.
Then include key metrics like reach, impressions, engagement rate, website clicks, and follower growth with brief explanations.
Q: What is the best social media analytics report template?
The best social media analytics report template focuses on insights instead of overwhelming clients with data. A strong template includes:
- Executive summary
- Performance overview with explanations
- Content performance breakdown
- Audience behavior insights
- Platform-specific reports
- Actionable recommendations
This structure helps clients quickly understand what worked, what didn’t, and what should happen next.
Q: Which social media metrics matter most in client reports?
The most important social media metrics for client reports include:
- Reach
- Impressions
- Engagement rate
- Website clicks
- Follower growth
Rather than reporting every available metric, focus on KPIs that directly support the client’s business goals and explain what influenced the results.
Q: How often should I send social media reports to clients?
The ideal reporting frequency depends on your campaigns:
- Weekly reports: Best for paid campaigns, launches, and active marketing efforts.
- Monthly reports: The most common option for tracking ongoing social media performance.
- Quarterly reports: Best for measuring long-term growth, benchmarking, and overall social media ROI.
Regardless of the schedule, every report should answer: What happened? Why did it happen? What should we do next?
Q: How do you make a social media report easy to read?
A social media report is easier to read when it uses simple language, clean visuals, and concise explanations. Clients value insights and next steps more than large amounts of raw data.
Q: What is the difference between a social media report and an analytics dashboard?
A social media analytics dashboard displays live performance data and metrics in real time. A social media report interprets that data by explaining trends, identifying what worked or failed, and recommending future actions.
Q: Can I automate social media reporting?
Yes. Social media reporting can be automated using analytics tools that collect data across multiple platforms and generate organized reports.
Automation saves time on data collection, allowing you to focus on analyzing performance and providing meaningful recommendations for clients.
Q: What tools can generate social media reports automatically?
Several social media management platforms can automatically generate analytics reports. For example, SocialBu Analytics collects performance data from multiple social media platforms in one dashboard, helping you create weekly, monthly, or quarterly reports faster.
Q: How do I measure ROI in a social media report?
To measure social media ROI, compare your campaign results against your business objectives. Track metrics such as website clicks, conversions, lead generation, engagement, and audience growth alongside marketing costs.
Q: What does a monthly social media report look like?
A monthly social media report typically includes:
- Executive summary
- Key performance metrics
- Content performance analysis
- Audience insights
- Platform-by-platform performance
- Action plan for the following month
This format provides enough data to evaluate progress while keeping the report focused and easy to understand.
Q: How do agencies create social media reports for clients?
Most agencies follow a structured reporting process. They gather performance data from social media platforms, analyze key metrics, identify successful and underperforming content, compare platform results, and summarize findings with clear recommendations.
Q: What are the best social media reporting tools?
The best social media reporting tools combine automated analytics, multi-platform reporting, visual dashboards, and actionable insights.
Q: How can I visualize social media data in reports?
Use simple charts, graphs, and screenshots of top-performing posts to visualize social media data. Avoid overcrowding reports with unnecessary visuals.
Q: What KPIs should be tracked in a social media marketing report?
A social media marketing report should track KPIs that align with campaign objectives, including:
- Reach
- Impressions
- Engagement rate
- Website clicks
- Follower growth
- Top-performing content
- Audience engagement trends
Focus on quality over quantity by explaining why each KPI changed and what actions should be taken to improve future performance.