Social media isn’t just about likes and shares anymore—it’s about understanding what makes your audience tick. Even if you’re a seasoned marketer or are just exploring the world of social media analytics, tracking the right metrics can make all the difference in 2026.
This blog will explore the top 13 social media metrics that matter most, helping you measure success, fine-tune your strategy, and stay ahead in the ever-evolving digital landscape. Keep reading to decode the numbers behind your online presence.
Why Tracking Social Media Metrics Is Important?
Social media success relies on understanding your audience and the effectiveness of your content. Social media metrics, essentially numerical measurements, provide valuable insights into the performance of your social media strategy and efforts.
Using these numbers, you can understand what content resonates most with your audience, how many people have viewed, liked, shared, and commented on your content, and how well your social media strategy aligns with your overall goals.
Here’s why tracking social media metrics is more important than ever:
Changing Algorithms
Social media platforms constantly update their algorithms, influencing what users see. By tracking metrics like engagement and reach, you can adapt your content strategy to keep pace with these changes and ensure your content reaches the right audience.
Shifting User Behaviors
User preferences and online habits are constantly evolving. Almost 91% of business owners say that social data and metrics help them better understand their customers’ behavior.
So, tracking metrics like video views and click-through rates (CTR) helps you understand what content formats and topics capture your audience’s attention and when they’re most active online. This allows you to tailor your content accordingly.
New Platform Features
Social media platforms constantly introduce new features. Tracking relevant metrics associated with these features (such as Instagram Reels views or Twitter Spaces listeners) helps you determine whether they effectively connect with your audience and achieve your goals.
What You Get?
Understanding the meaning behind your social media metrics allows you to gain valuable insights that empower you to:
- Identify areas for improvement: Metrics pinpoint what’s working and what’s not, allowing you to refine your content strategy for better results.
- Measure ROI (Return on Investment): Tracking metrics associated with conversions (sales, leads) helps you demonstrate the value your social media efforts or money spent bring to your business.
- Gain a deeper understanding of your audience: Metrics reveal valuable insights into your audience demographics and their online behavior. This knowledge empowers you to tailor content that resonates with them.
- Optimize your social media strategy for success: Analyzing and tracking metrics can help you make data-driven decisions to improve your overall social media performance and achieve your goals.
Here is a list of the top 13 social media metrics you must track in 2026 to stay ahead of others.
Social Media Engagement Metrics
Among all social media metrics, engagement metrics are the most important ones for your social media presence. They tell you how effectively your content resonates with your audience and sparks interaction. Here are the top engagement metrics you must be tracking in 2026.
Engagement Rate
This metric provides a more comprehensive picture of your content’s performance. The engagement rate is valuable because it shows the percentage of people who saw your content and took action.
There are a few ways to calculate the engagement rate, but a common formula is:
Engagement Rate = (Total Engagements / Total number of Followers) x 100
- Total Engagements: The sum of all interactions with your post (likes, shares, comments, clicks, etc.)
- Total followers: The total number of followers you have at that time.
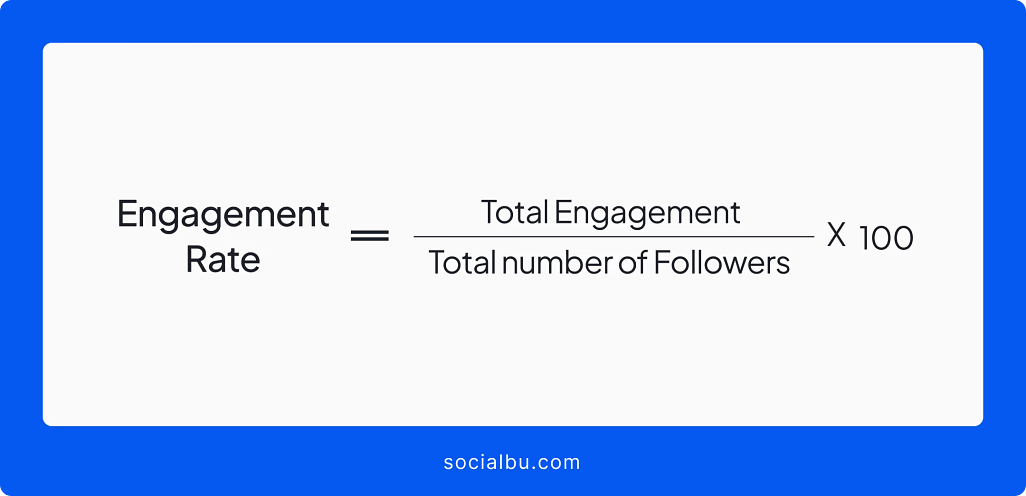
A higher engagement rate signifies that your content resonates with your audience and encourages active participation.
Virality Rate
The virality rate measures how quickly and widely your content spreads across the platform. It indicates the potential for your content to go viral.
To calculate the virality rate, divide a post’s number of shares by its impressions. Then, multiply by 100 to get the virality rate as a percentage.
Virality Rate = (Total Shares / Total number of Impressions) x 100
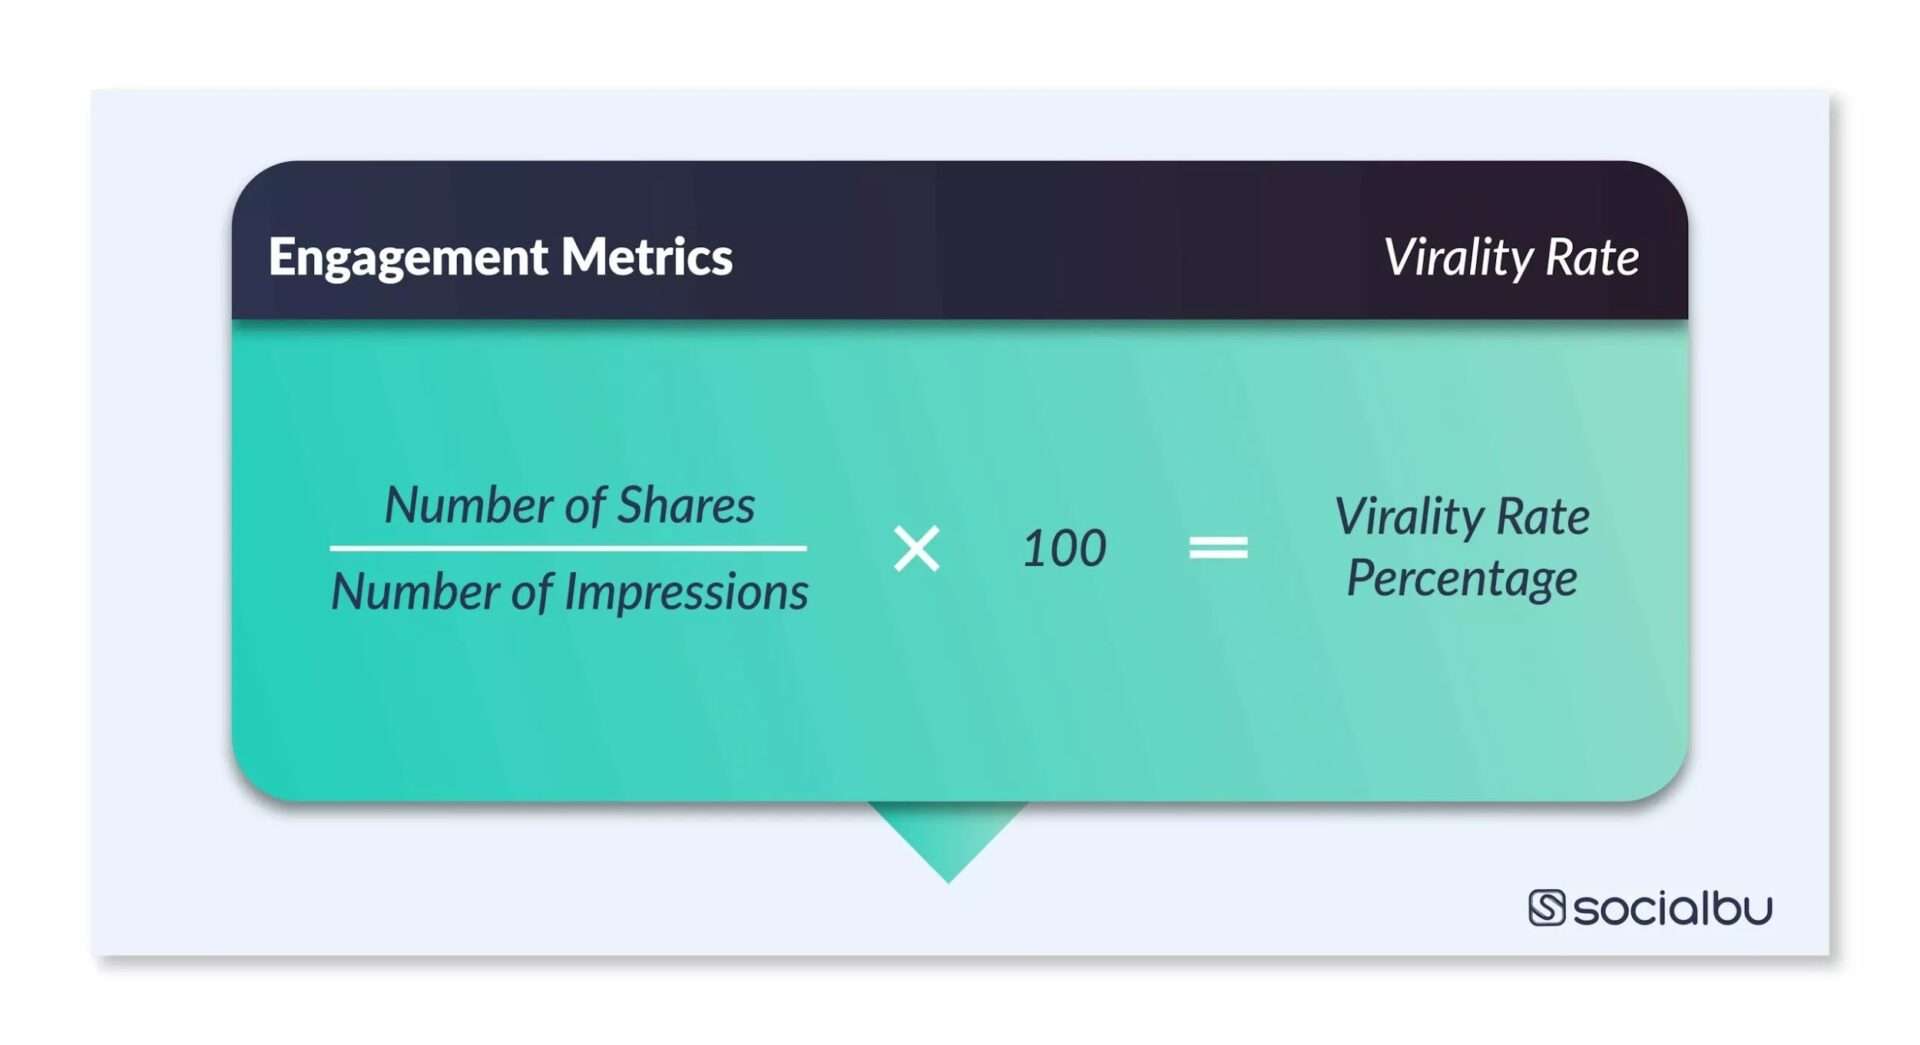
- Total Shares: The number of times users have shared your content.
- Total Impressions: The number of times your content appears on users’ screens.
A high virality rate suggests your content is highly shareable and has the potential to reach a wider audience organically.
Amplification Rate
The amplification rate is another crucial social media metric. It measures the effectiveness of your content in generating shares and mentions per post relative to the number of overall followers on other platforms. It indicates how well your content encourages users to take further actions and is spreading beyond your social channels.
Amplification Rate = (Total Post Shares / Total number of Followers) x 100
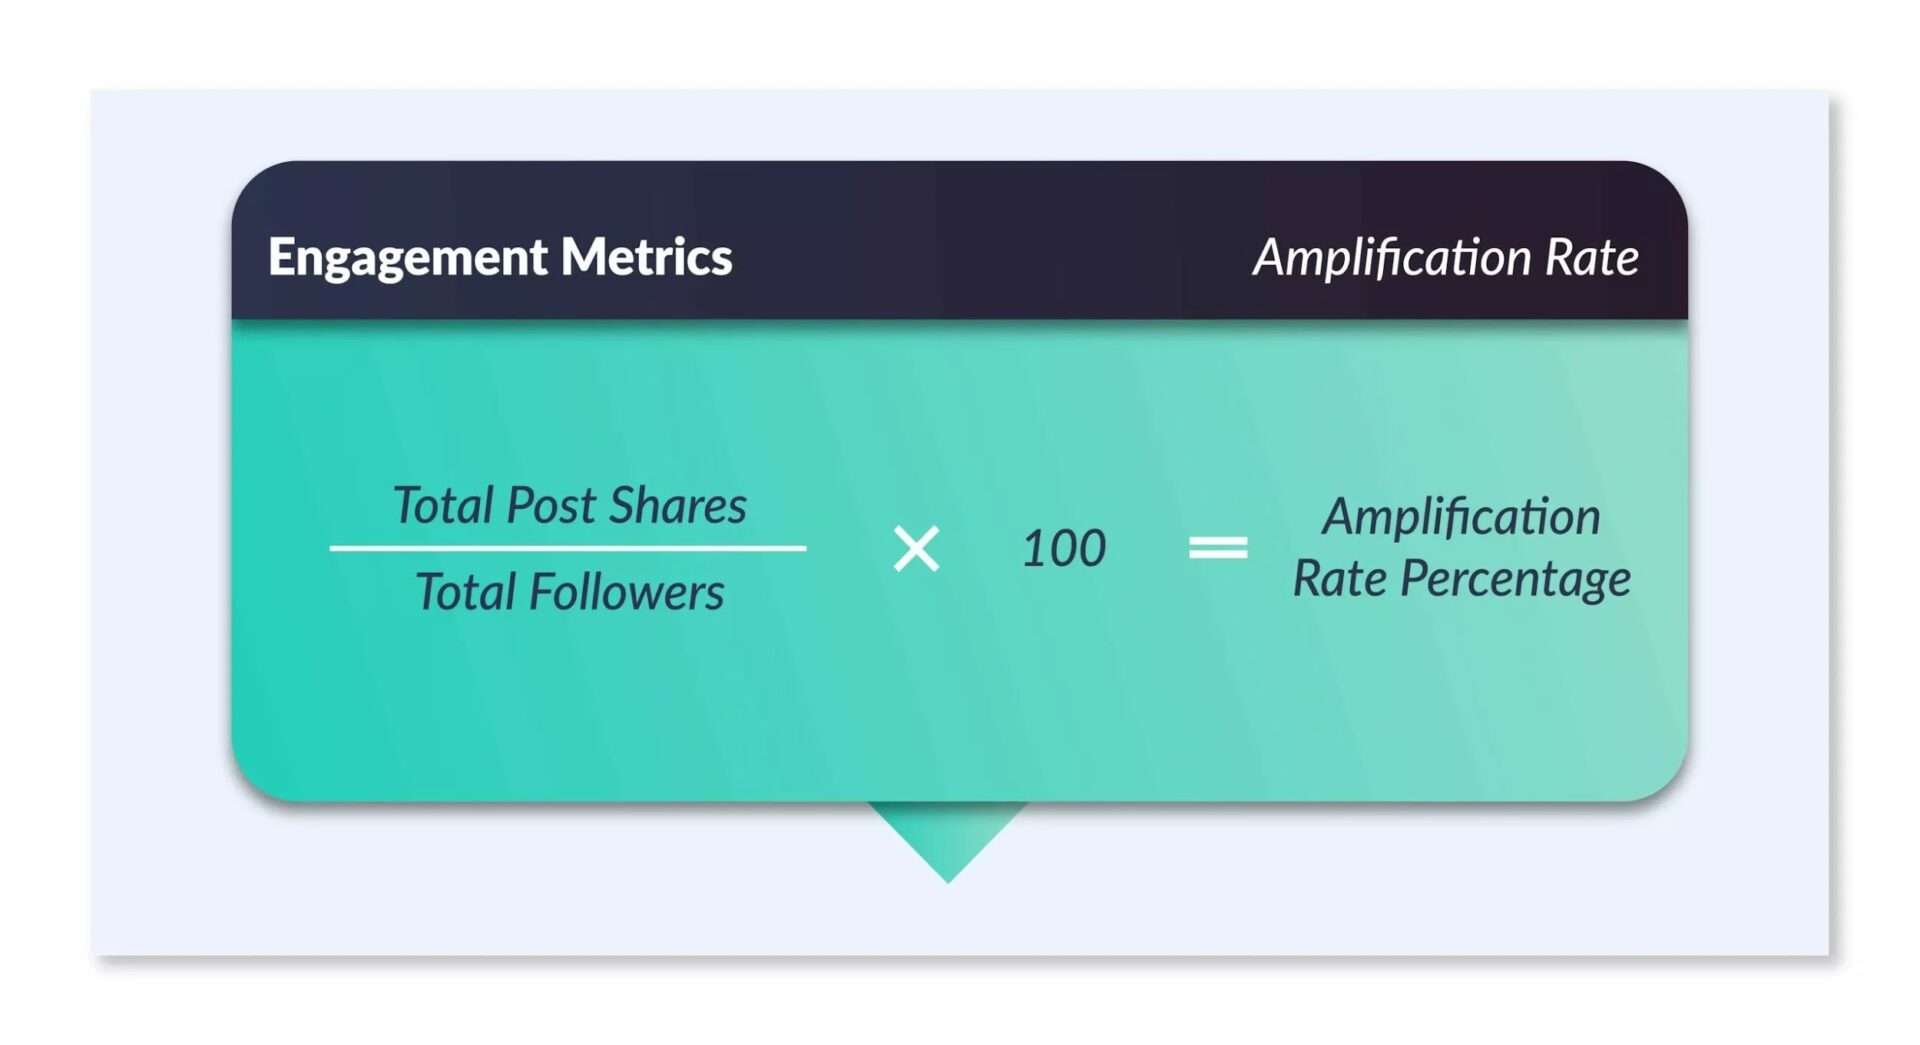
Total Shares: The number of shares your single post gets.
Total Followers: The total number of followers you have.
A higher amplification rate suggests that your content effectively drives users to take desired actions, such as sharing it, visiting your website, or purchasing.
Social Media Awareness Metrics
In 2026, awareness metrics should be tracked in addition to engagement metrics. These key performance indicators (KPIs) measure how well your brand reaches and resonates with its audience on social media.
The awareness metrics focus on your brand’s visibility and recognition. They help you understand how many people are aware of your presence and engaging with your content.
Reach
Reach represents the unique individuals who saw your content at least once within a specific timeframe. It measures your content’s potential exposure to your target audience.
This metric helps you understand how far your content spreads and reaches new people. However, it’s crucial to remember that reach can be influenced by factors like algorithm changes and platform limitations.
Impressions
Impressions measure the total number of times your content appears on users’ screens, regardless of whether they interact with it or not. It can be higher than reach because a single user might see your post multiple times.
This awareness metric helps you understand the overall exposure your content receives. However, multiple impressions from the same user don’t necessarily equate to increased engagement.
Video Views
Video views measure the number of times your video content has been watched on social media. Different platforms have varying definitions of a “view,” with some counting a view after a few seconds of watch time while others require a longer duration.
Follower/Audience Growth Rate
The follower/audience growth rate shows the number of new followers you gain within a specific period. While follower growth is essential, remember that quality is more important than quantity. Focus on attracting engaged followers who resonate with your brand.
There’s no specific formula for follower growth, but you can calculate the growth rate. Subtract the number of followers you had at the beginning of a period (e.g., month) from the current number. Then, divide this difference by the starting follower count and multiply by 100 to express it as a percentage.
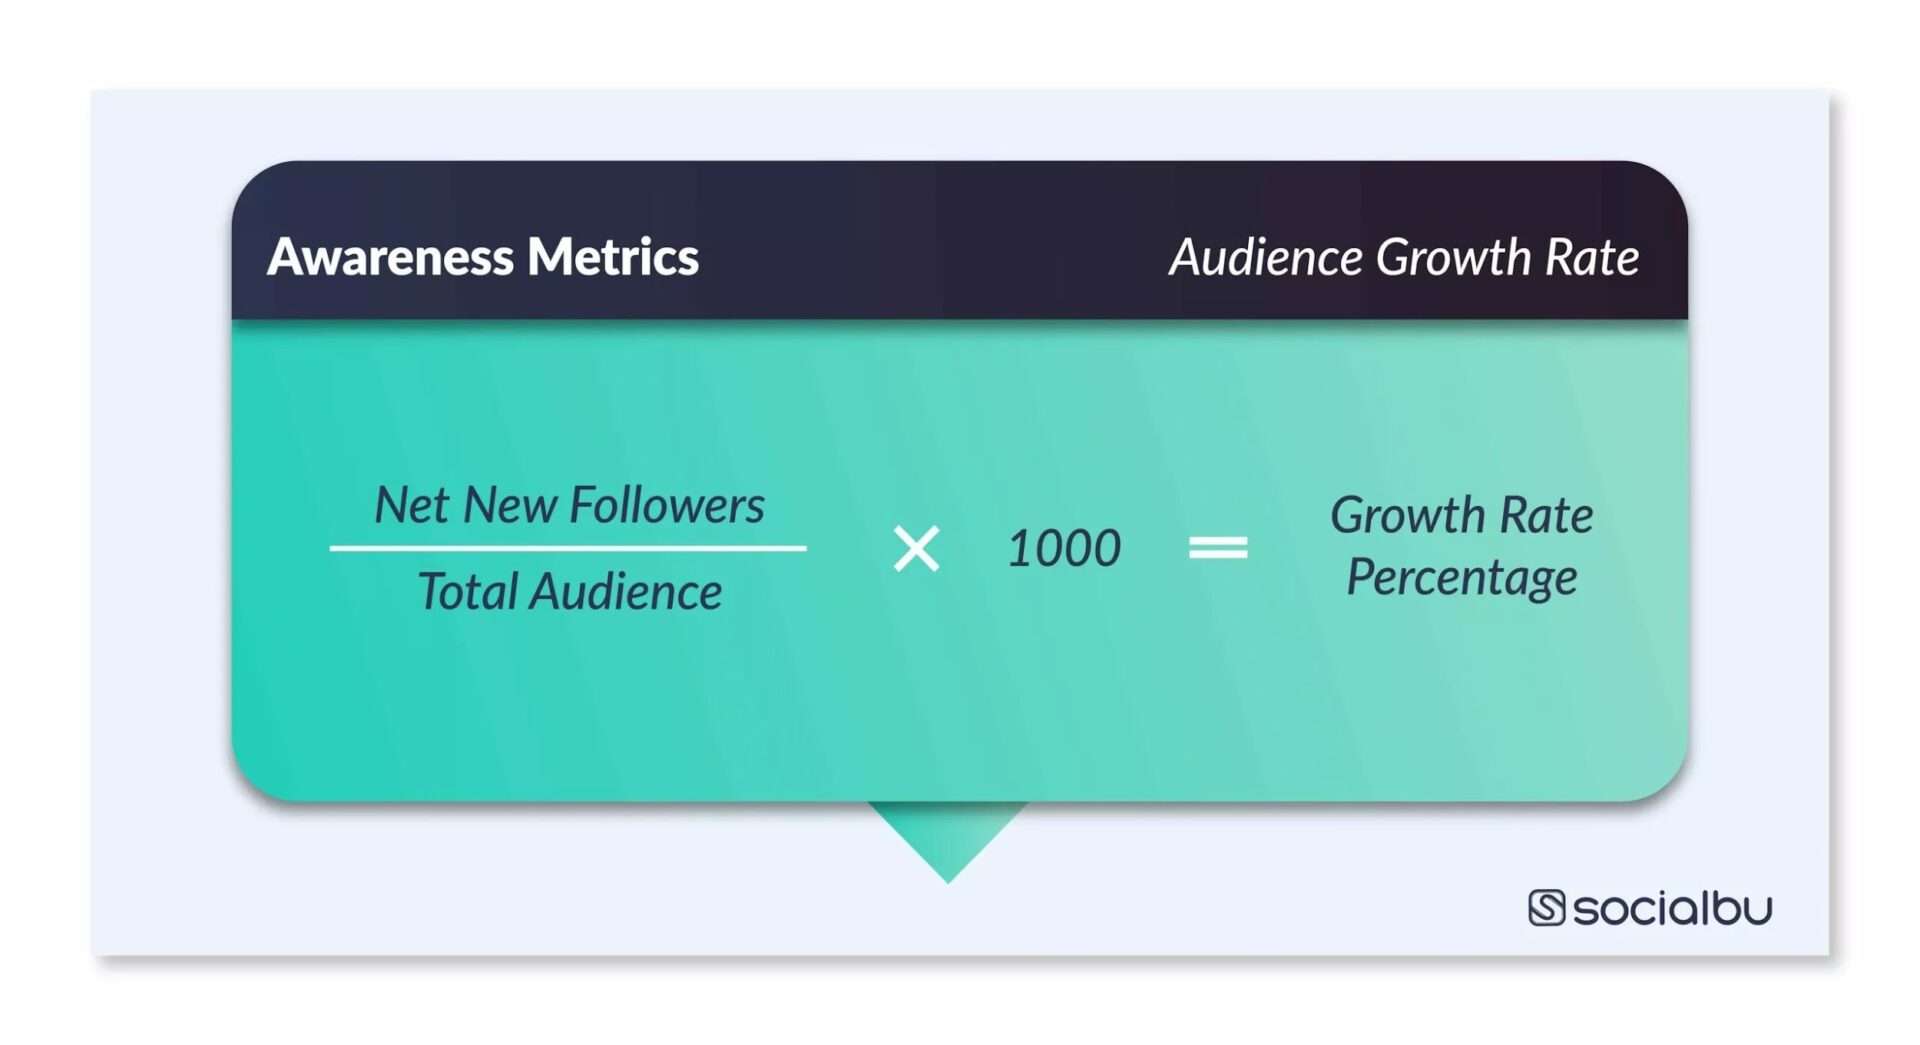
For example, if you started a month with 1,000 followers and ended with 1,100 followers, your follower growth rate would be: [(1,100 followers – 1,000 followers) / 1,000 followers] x 100 = 10% growth rate.
The follower/audience growth rate helps you assess the success of your audience acquisition efforts. It’s essential for tracking your overall social media growth and identifying trends over time.
Social Media Marketing Metrics
Once you have figured out your engagement and awareness metrics, you must determine the marketing metrics to ensure you are making progress.
These performance indicators measure the effectiveness of your social media marketing campaigns. They help you evaluate how well your content drives engagement, generates leads,, and contributes to your overall marketing goals.
Click-Through Rate (CTR)
CTR shows how often users click a link in your post or content to see the additional linked content. This metric measures the effectiveness of your content in driving traffic to your website or online store.
It represents the percentage of people who clicked on a link or ad compared to the total number of people who saw it. It’s calculated as:
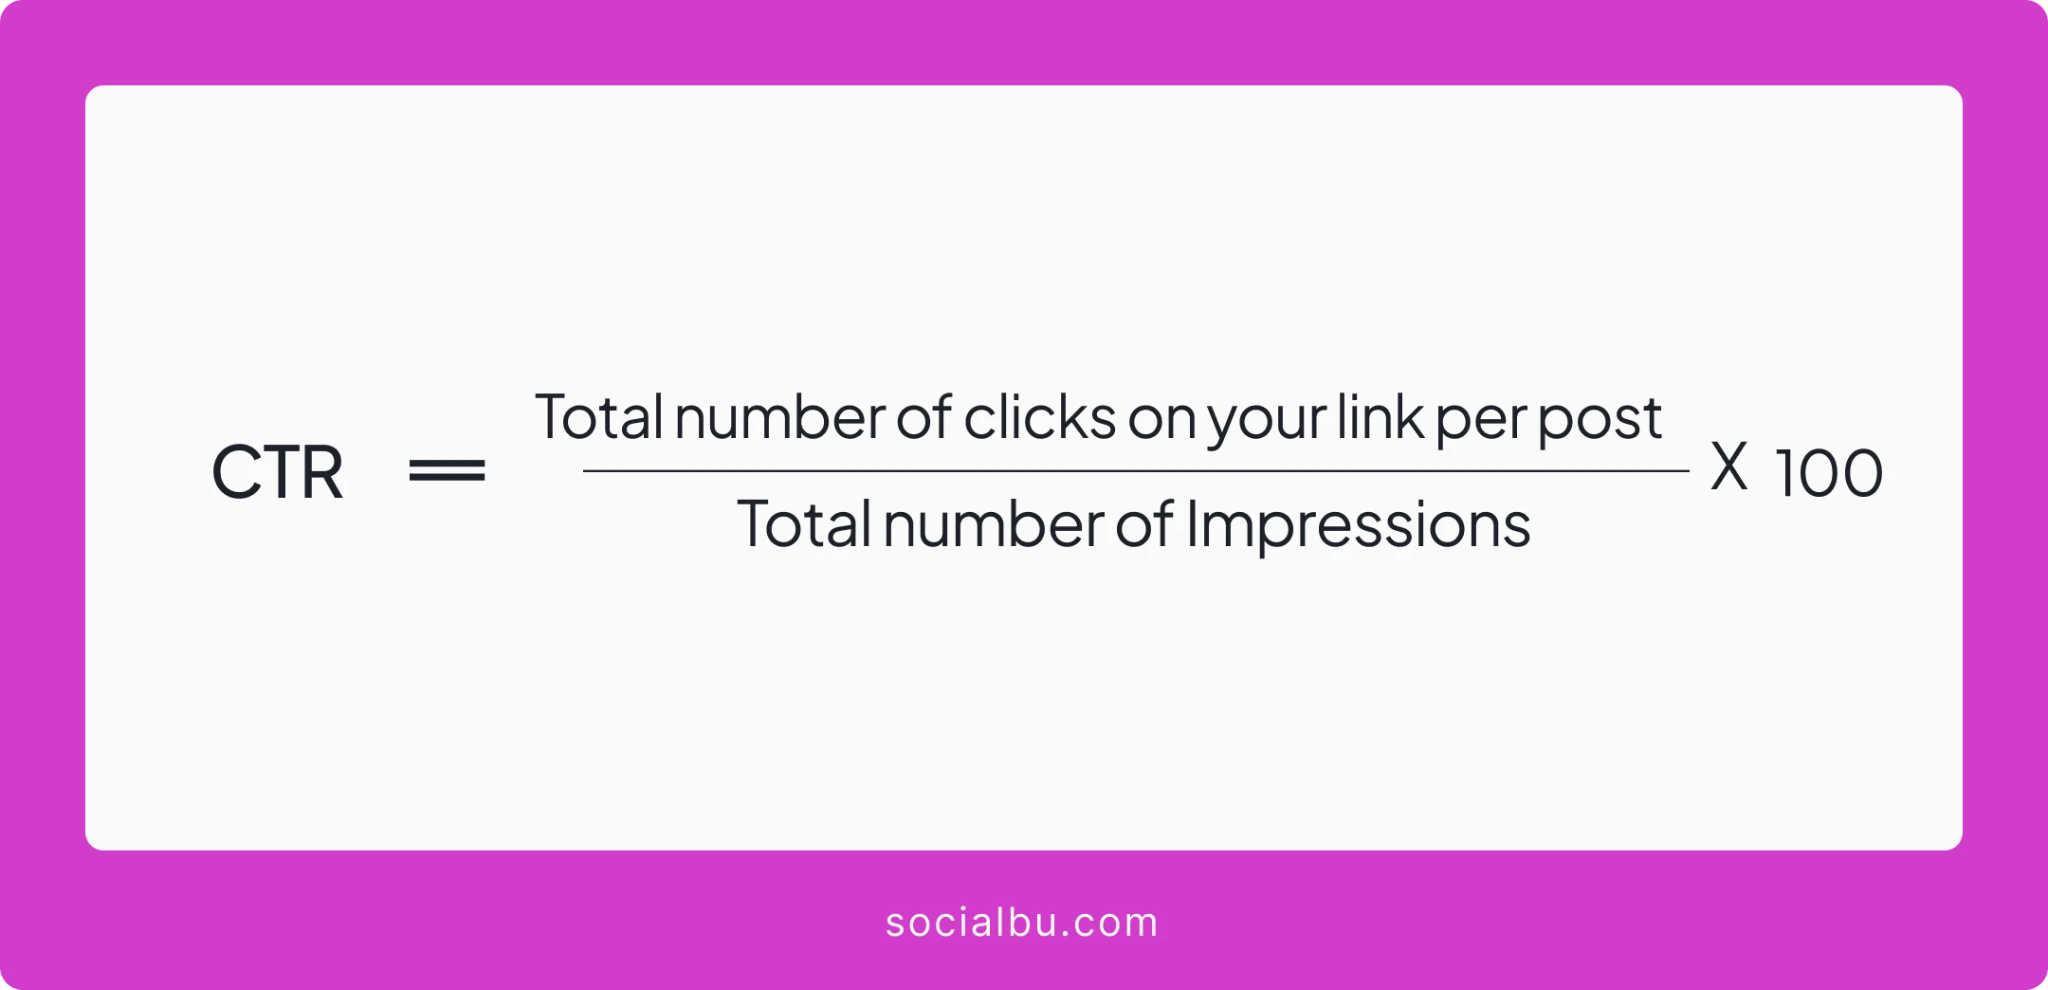
A high CTR indicates that your content is engaging and successful in directing users to your desired destination.
Cost per Thousand Impressions (CPM)
(CPM) measures the cost of displaying your ad 1,000 times on a social media platform. It is more about views than actions. It helps you compare the cost-effectiveness of different ad placements and campaigns.
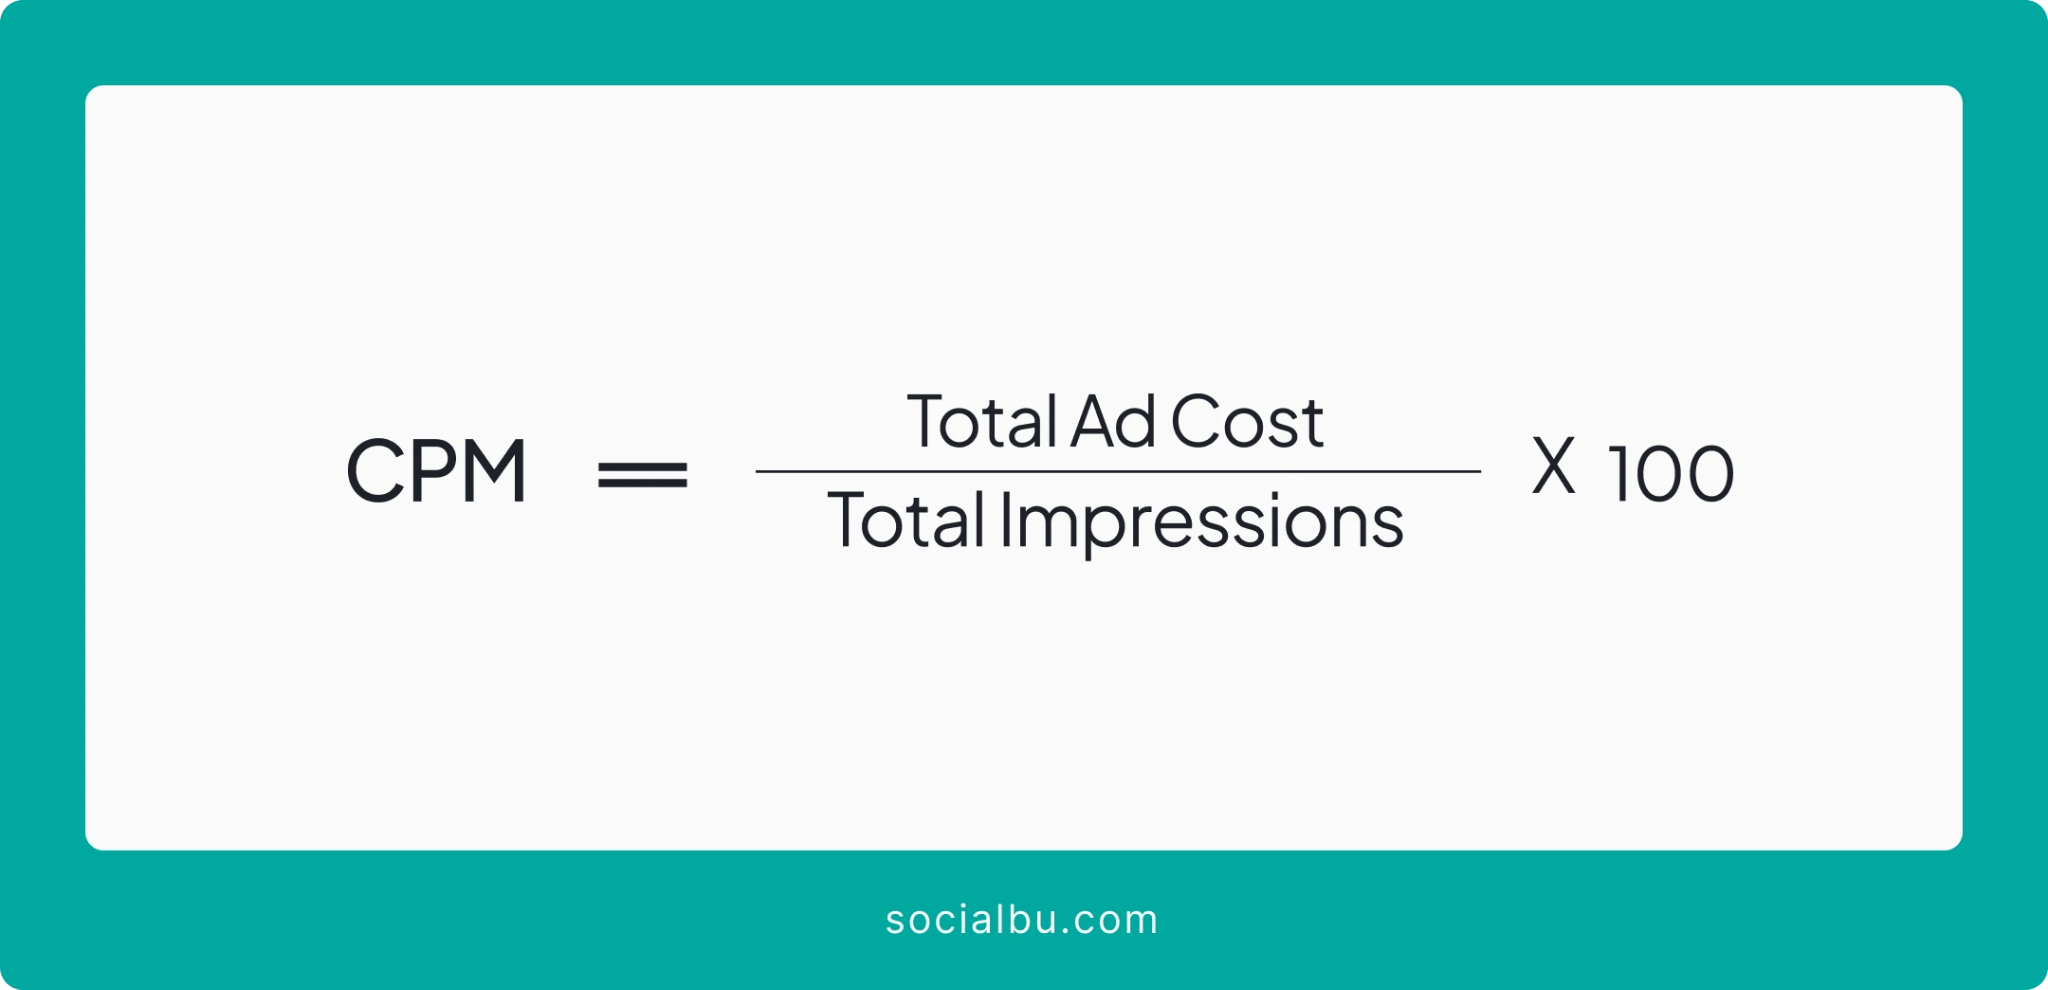
A lower CPM generally indicates a more cost-effective ad campaign.
Cost-per-Click (CPC)
Cost per Click (CPC) measures the amount you pay for each click on your social media ad. It helps you evaluate the efficiency of your ad campaigns in driving traffic to your website or desired landing page.
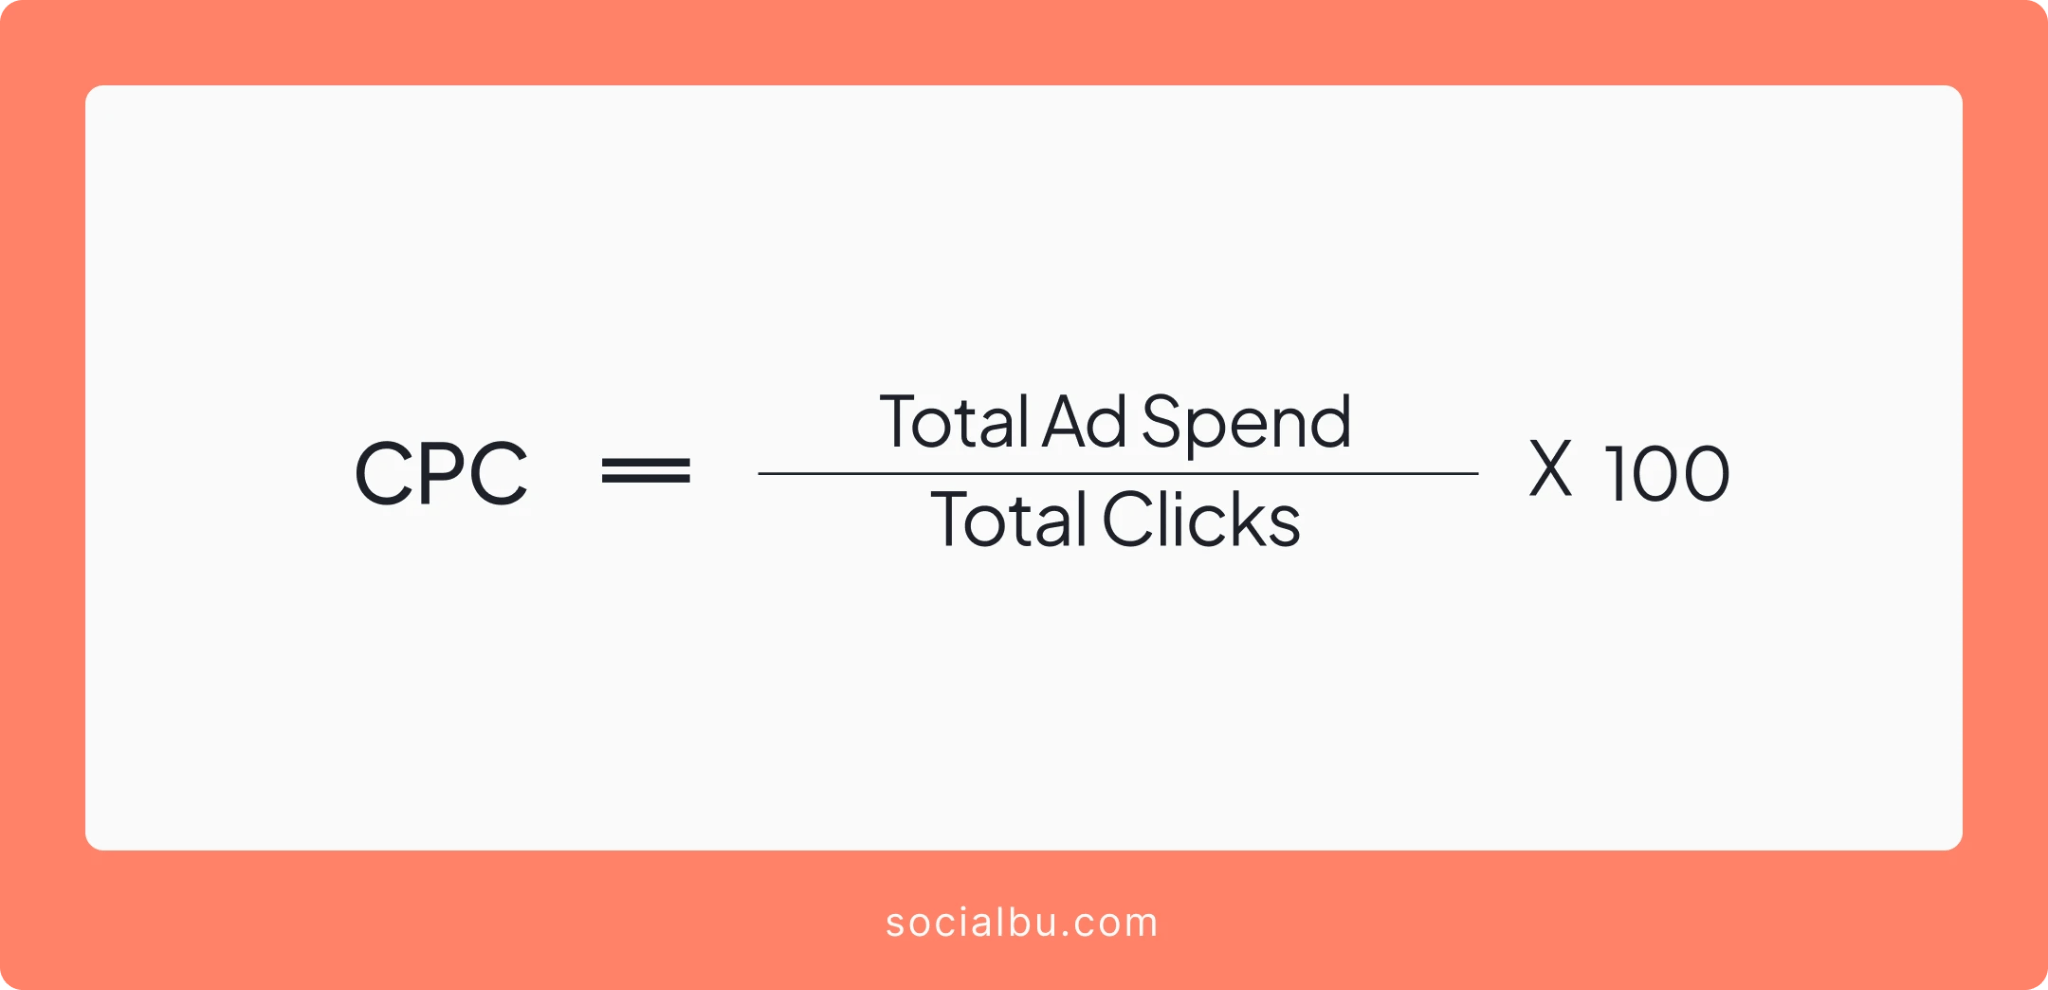
The analytics also show the CPV for the social media platform where your ad is running. A lower CPC means paying less for each click, indicating a more efficient ad campaign.
Conversion Rate
Conversion rate is one of the most important social media metrics. It measures the percentage of people who take a desired action after seeing your social media ad or post. This action could be a purchase, sign-up, lead generation, subscription, or predefined goal.
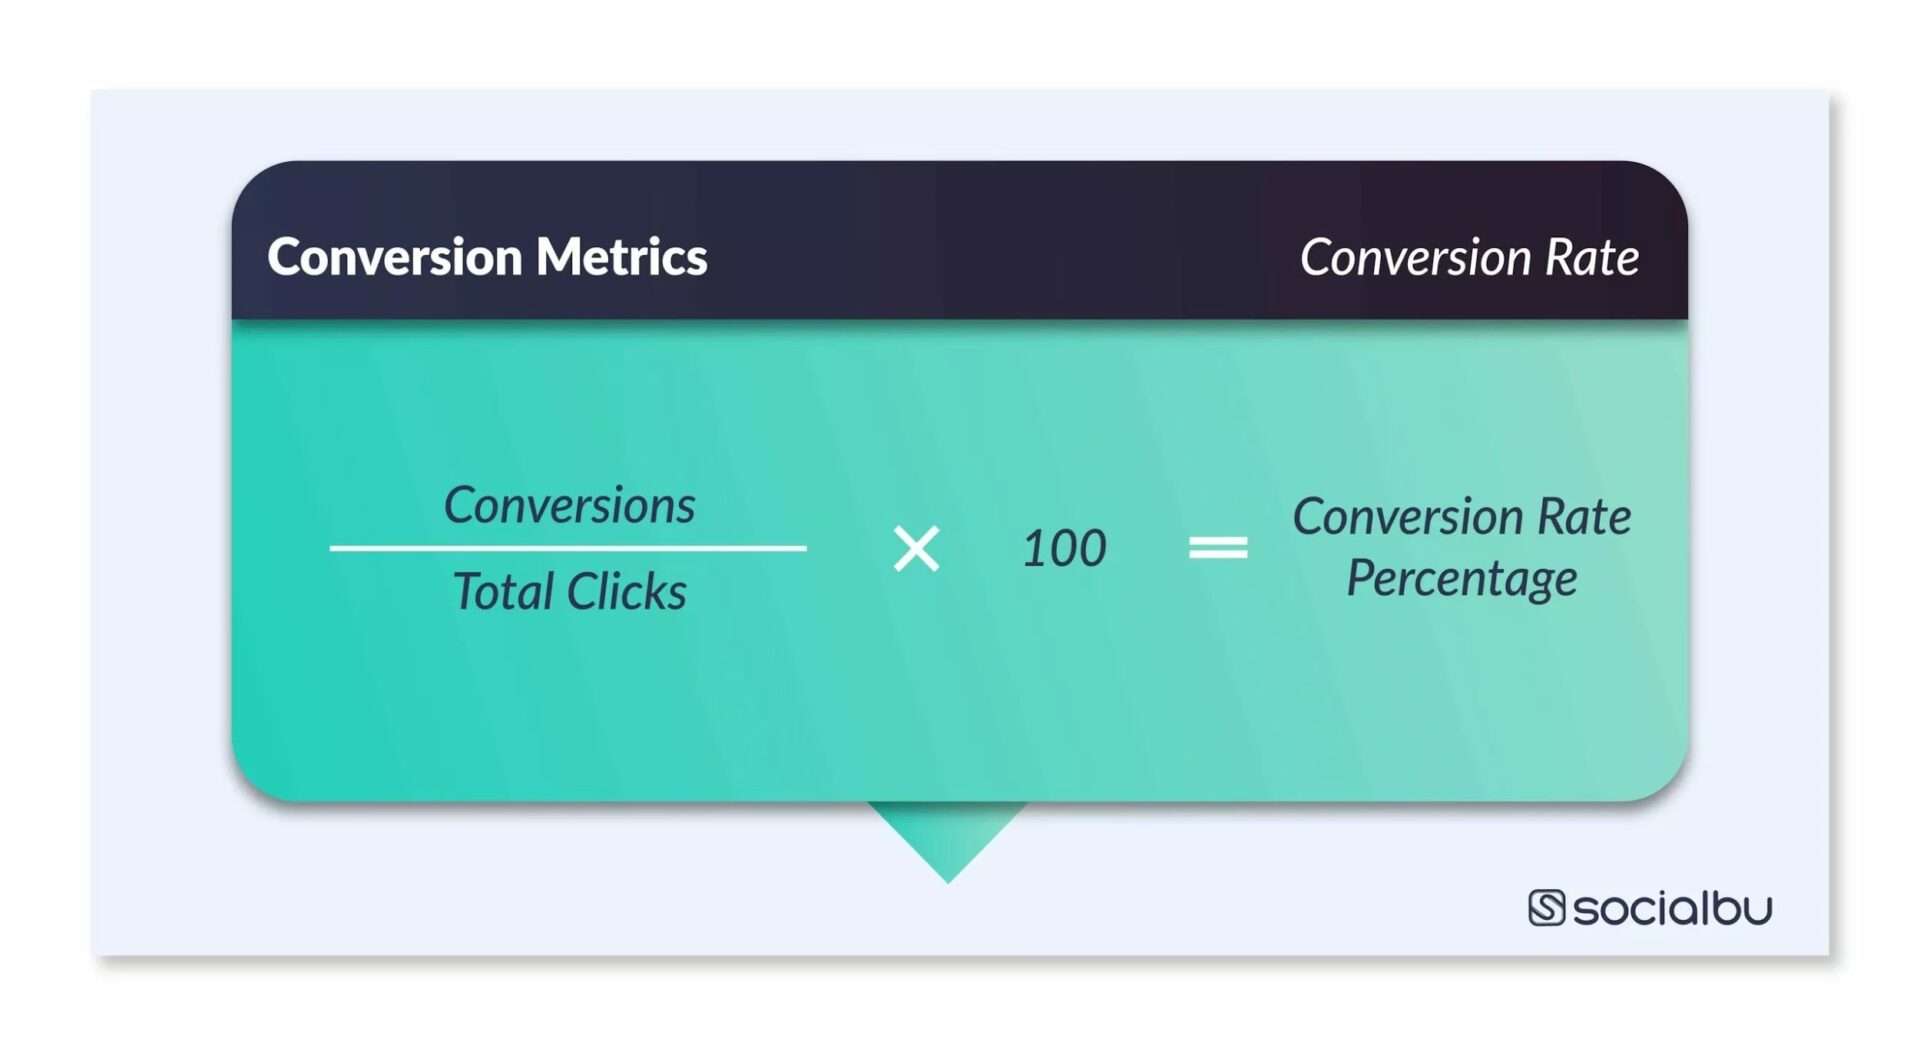
A higher conversion rate indicates that your ad or post effectively drives desired actions or attracts new customers. By tracking these social media marketing metrics, you can gain valuable insights into the performance of your campaigns, optimize your ad spend, and measure the return on investment (ROI) of your social media marketing efforts.
Other Key Social Media Metrics
Here are some other key social media metrics to track in 2026.
Customer Satisfaction (CSAT) Score
The customer satisfaction (CSAT) score measures customers’ happiness with your products or services. While primarily used in customer service, it’s also relevant to social media, as it reflects how well you address customer concerns and queries on these platforms and the overall customer experience.
How to measure CSAT:
- Directly ask customers: Use surveys or polls on social media to gauge customer satisfaction. For easy responses, use a rating scale (e.g., 1–5 or smiley faces).
- Analyze sentiment: Monitor social media conversations to gauge customer sentiment. Positive comments, replies, and reviews contribute to a higher CSAT score.
It’s calculated as a percentage of satisfied customers.
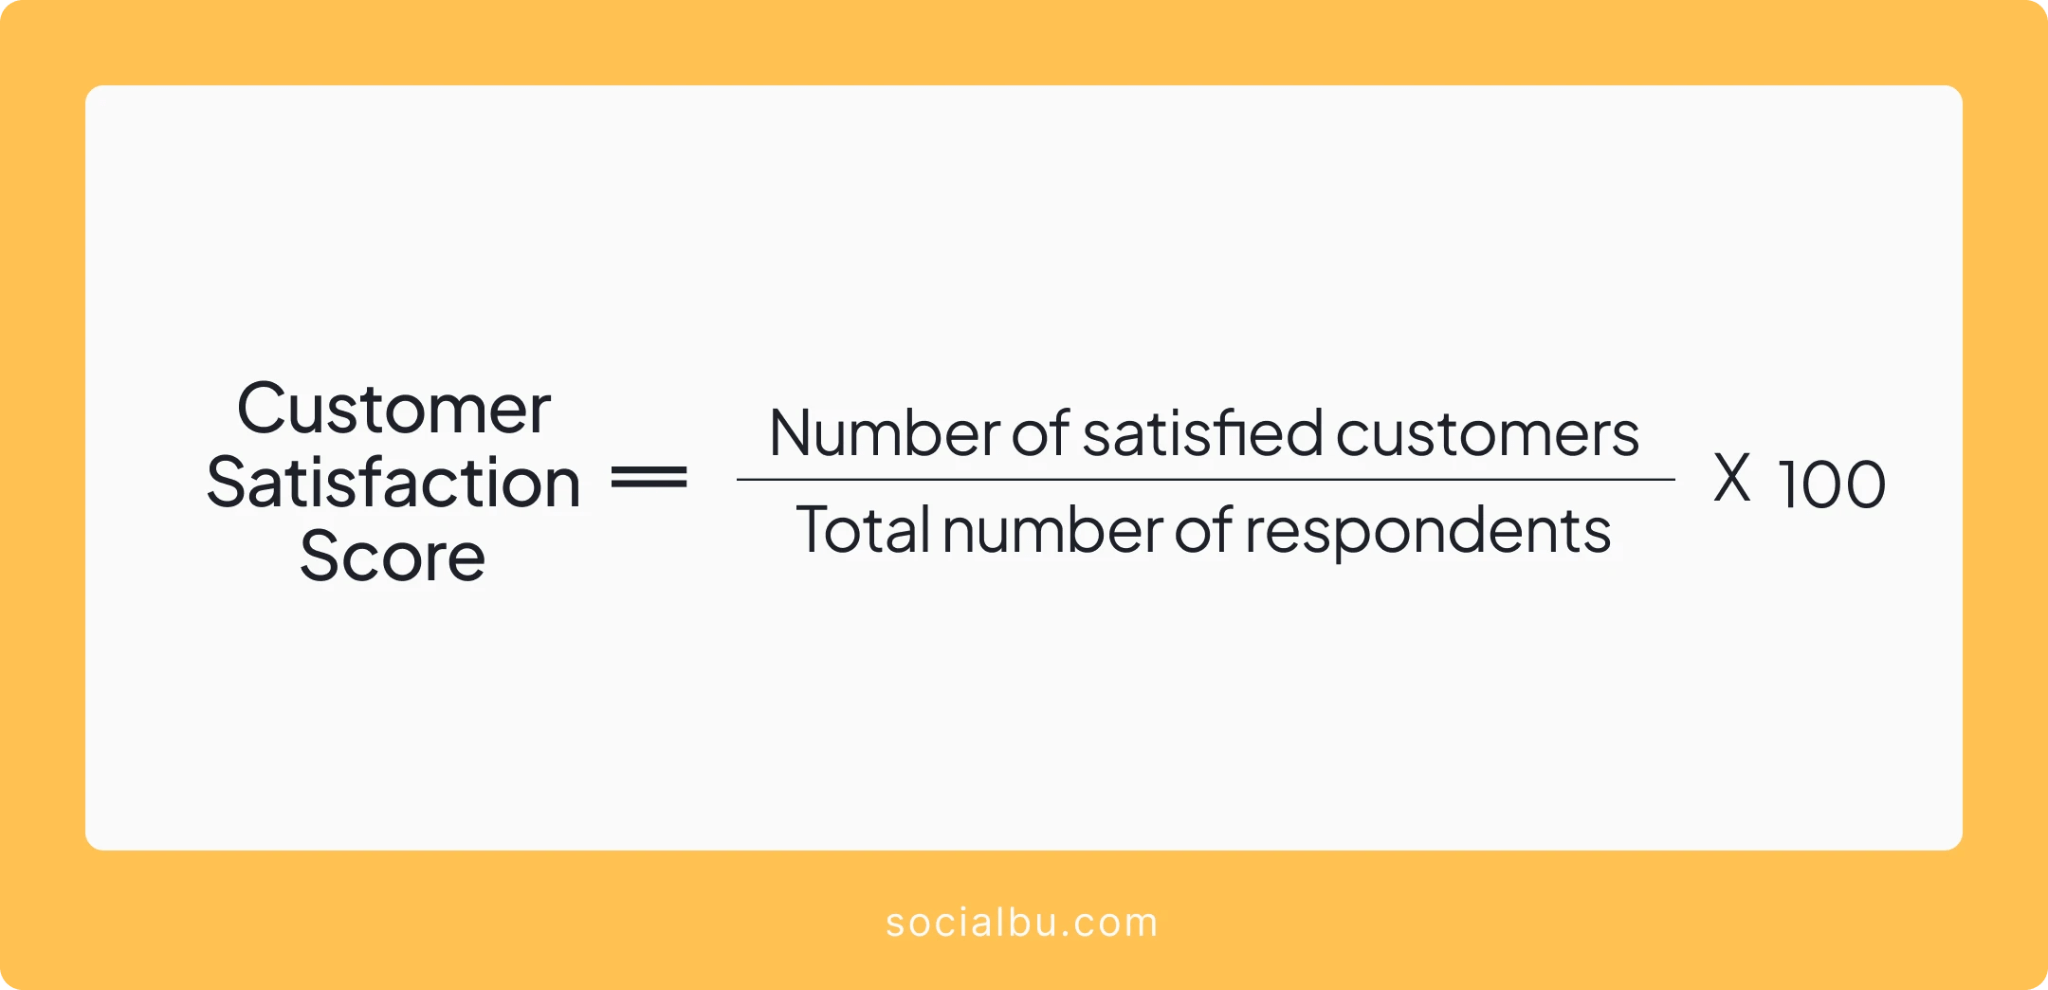
For example, if you received 100 responses and 80 customers expressed satisfaction, your CSAT score would be 80%.
Social Share of Voice (SSOV)
Social share of voice (SSOV) measures your brand’s visibility and the number of people talking about it on social media compared to your competitors within your industry. It helps assess your brand’s influence and dominance in the online conversation.
Brand mentions can be like this:
- Direct (tagged—e.g., “@SocialBuHootsuite”)
- Indirect (untagged—e.g., “SocialBu”)
How to measure SSOV:
Track brand mentions: Monitor social media platforms for mentions of your brand and competitors.
Calculate SOV: Divide the number of brand mentions by the total number of mentions for your industry.
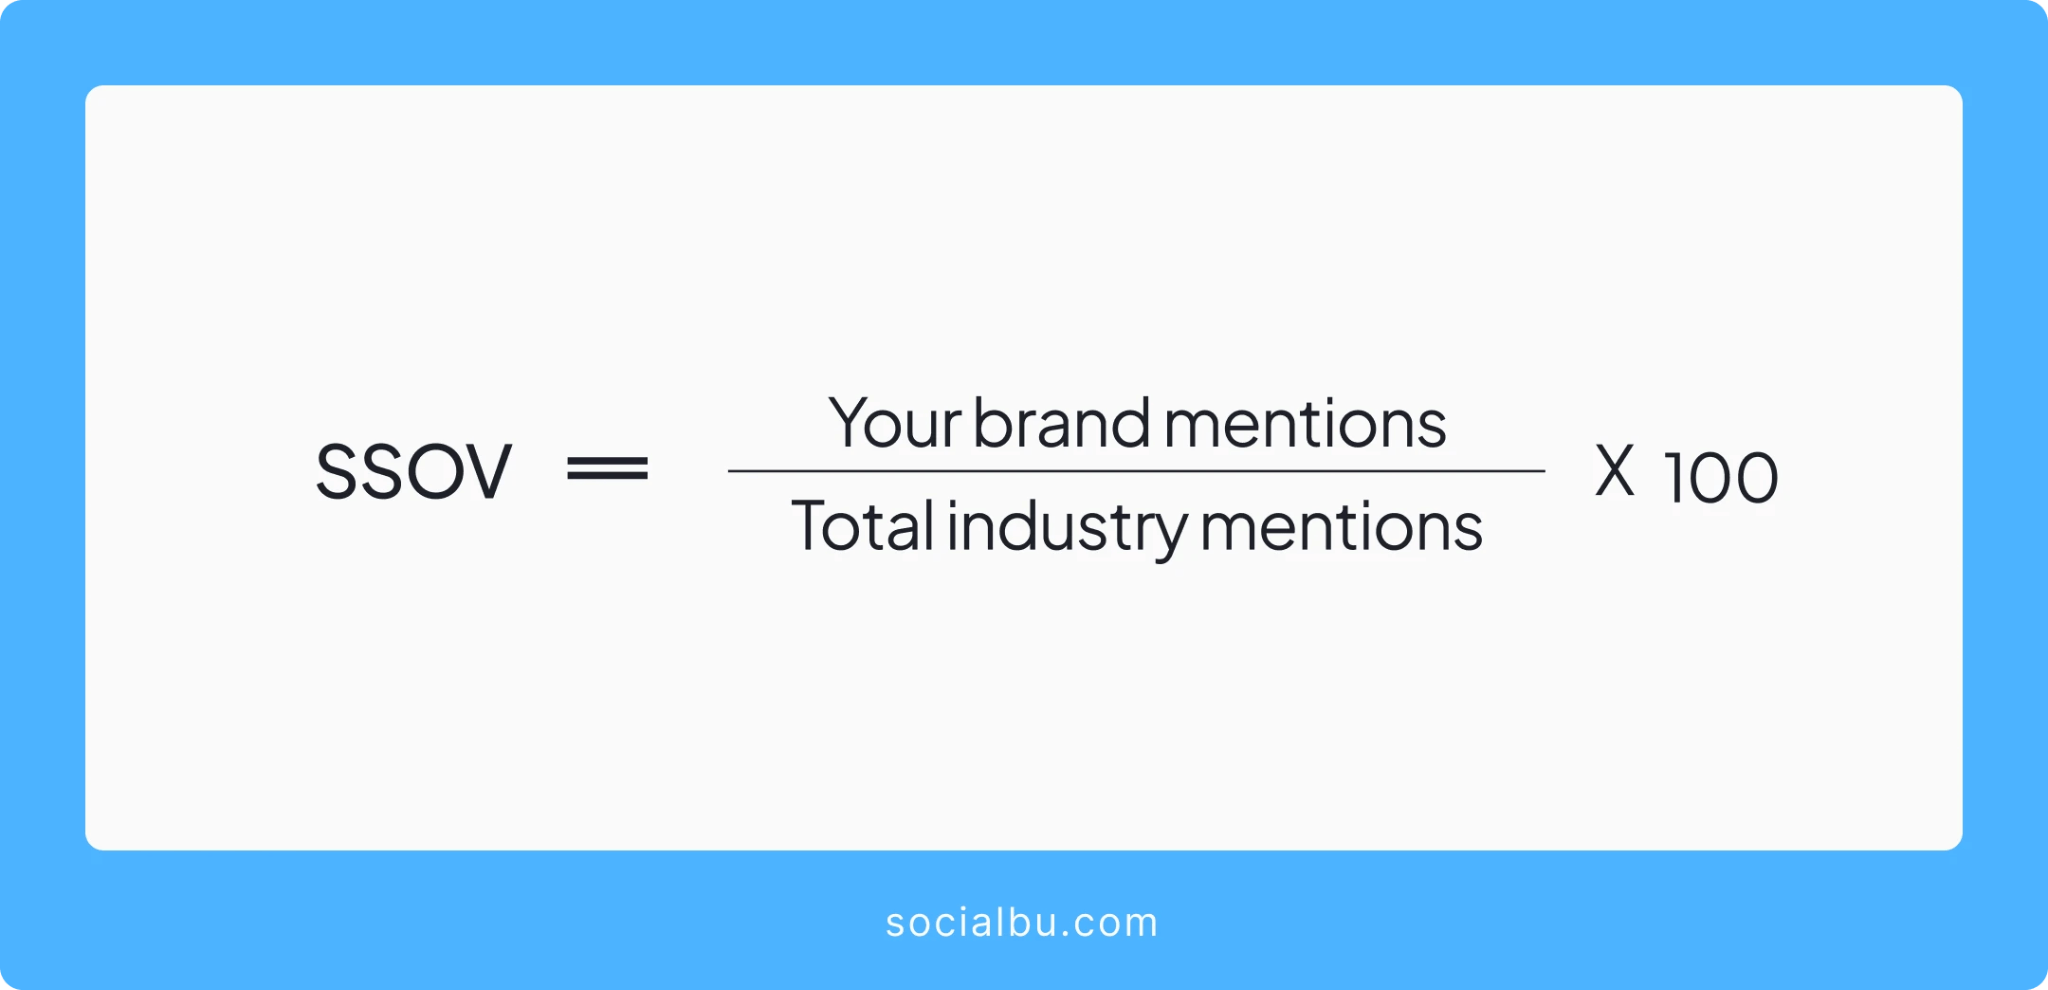
For example, if your brand received 500 mentions and the total industry mentions were 5,000, your SOV would be 10%.
Note: Calculating accurate SOV can be complex, especially for large industries. Social listening tools can help streamline this process.
Social Share of Voice (SOV) measures your brand’s visibility on social media compared to your competitors. It indicates how much conversation you’re driving within your industry or niche.
Tools for Tracking Social Media Metrics
Feeling overwhelmed by the sheer amount of social media data you need to track? Don’t worry; there are numerous tools available to help you measure your social media marketing performance and make sense of all those social media metrics.
Here’s a breakdown of some popular options:
Built-In Analytics Platforms
Most major social media platforms offer built-in analytics dashboards. These tools are free to use and provide valuable insights into key metrics like reach, engagement, and audience demographics directly within the platform.
Some of the native social media metrics tools are as follows:
- Twitter Analytics
- Meta Business Suite (Facebook and Instagram)
- TikTok Analytics
- LinkedIn Analytics
- Pinterest Analytics
Social Media Management Tools – SocialBu
You can rely on online social media management tools if you want detailed insights into your social media metrics to track your success. They offer comprehensive analytics features that go beyond what native platforms provide.
These tools allow you to track metrics across multiple social media platforms in one central location, simplifying data analysis and offering more profound insights.
SocialBu is also an all-in-one social media management tool that allows you to track all your social media metrics from Twitter, Instagram, Facebook, TikTok, Pinterest, and LinkedIn all in one place and easily create custom reports.

It helps you analyze your content strategy and various social media metrics, generate comprehensive content performance reports in charts and graphs that are easy to understand, and make better decisions.
SocialBu helps you identify top-performing posts, gain insights into individual posts, and track growth trends. It even provides all the charts in one place, allowing you to compare which accounts and posts perform best.
So, track your social media performance and growth trends to get more out of your marketing strategies with SocialBu. Schedule and publish your posts and Reels ahead of time, and analyze the results on the same single dashboard.
Sign up for a free 7-day trial today!
Wrap Up
Understanding and tracking the right social media metrics can transform your strategy from “just okay” to absolutely game-changing. The metrics we’ve covered will help you focus on what matters: building brand awareness, driving engagement, or boosting conversions.
Ready to take your social media performance to the next level? SocialBu, the ultimate social media management tool, makes tracking these metrics a breeze! From real-time analytics to scheduling and automation, SocialBu has everything you need to manage your social media like a pro. Start your journey to smarter social media marketing today with SocialBu!
FAQs
Q: What are Social Media Metrics?
Social media metrics are data points that measure the performance of your social media efforts. They help you understand your audience, track engagement, and measure the impact of your campaigns.
Q: What are the Best Social Media Performance Metrics?
The best social media performance metrics vary depending on your goals. Key metrics include:
- Engagement rate,
- Reach,
- Impressions,
- Click-through rate,
- Conversion rate,
- and audience growth.
Q: What is the KPI for Social Media?
Social media KPIs (Key Performance Indicators) are specific, measurable targets aligned with your business objectives. They help you track progress and make data-driven decisions.
Q: What is the 80/20 Rule in Social Media Marketing?
The 80/20 rule suggests that 80% of your social media content should be informative, engaging, and valuable to your audience, while 20% can be promotional. This balance helps build trust and relationships with your audience and drives conversions.
Q: How to Measure Social Media Visibility?
Social media visibility is measured through various metrics, such as engagement, reach, impressions, click-through rates, conversions, and audience growth. Social media analytics tools provide detailed data for analysis.
Q: What is a Social Media Matrix?
A social media matrix is a visual representation of different social media platforms, their key features, target audiences, content formats, posting frequency, and key performance indicators in table form. It helps you compare and select the most suitable platforms for your business and marketing goals.