As brands navigate a crowded digital landscape, they often struggle to identify important Facebook metrics that reflect their performance and audience engagement. This uncertainty can lead to missed opportunities and wasted resources.
However, the right insights can sharpen your strategy, allowing you to connect with your audience like never before. We will discuss the top nine metrics that matter most, guiding you through their significance and how to leverage them to drive engagement and growth.
1. Engagement Rate
The engagement rate is a key metric that measures how effectively your audience interacts with your content on Facebook.
It represents the percentage of users who engage with your posts through likes, comments, and shares.
High engagement rates suggest that your content resonates well with your audience, increasing its visibility and impact.
Importance of Measuring Interactions
Tracking interactions is essential for understanding content performance. Each like, share, or comment gives insight into your audience’s preferences and interests.
When you know what types of content generate the most engagement, you can tailor your future posts accordingly.
This targeted approach boosts your overall social media strategy, helping you create content that captures attention and encourages interaction.
Key Formulas for Calculating Engagement Rates
To calculate engagement rates, use the following formulas:
Calculate Engagement Rate by Followers
Engagement Rate= {Total Interactions (Likes + Comments + Shares) / Total Followers} × 100
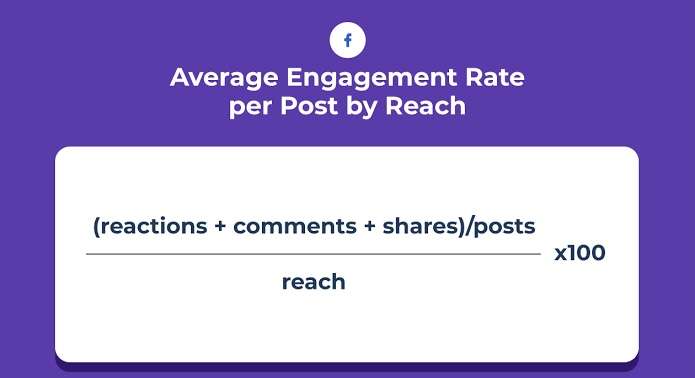
Calculate Engagement Rate by Reach
Engagement Rate= {Total Interactions (Likes + Comments + Shares) / Total Reach} × 100
Utilizing these formulas allows you to assess how effectively your engagement efforts convert your audience into active participants.
2. Reach
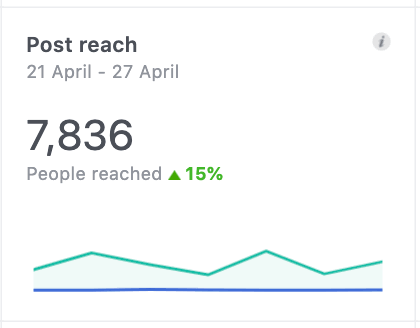
In the context of Facebook metrics, reach refers to the total number of unique users who see your content.
Understanding reach is pivotal for marketing strategies, as it measures brand visibility and provides insight into the effectiveness of your posts.
Reach can be divided into the following two categories:
Organic Reach
It measures the number of users who view your posts without any paid promotion. It reflects the true power of your content and its alignment with your audience’s interests.
Paid Reach
It encompasses the number of users who see your content as a result of advertising efforts. This approach can significantly boost visibility, particularly for targeted campaigns.
Both reach types are essential in gauging how well your content connects with your audience, ultimately allowing you to refine your social media strategy.
Tools for Measuring Reach
To measure reach effectively, you can utilize insights from Facebook’s native analytics tool, Facebook Insights, and third-party tools for a more unified view.
Knowing your reach metrics enhances your ability to optimize content, as it identifies which posts successfully connect with users.
Moreover, SocialBu’s analytics features can provide deeper insights into your reach performance, helping you formulate strategies to expand visibility and engagement.
3. Impressions
Impressions refer to the number of times your content appears on users’ screens. This includes multiple views by the same user, giving you a clear picture of how often your content is displayed.
Impressions can be categorized as either organic or paid. Organic impressions occur when your content is shared or appears naturally in users’ feeds, while paid impressions stem from advertising efforts.
Importance of Tracking Impressions
Tracking impressions is vital for assessing content visibility on Facebook. High impression numbers suggest your content is being displayed widely but do not inherently indicate engagement.
Therefore, analyzing impressions with engagement metrics gives a more comprehensive view of performance.
Insights from Analyzing Impression Metrics
By analyzing impression metrics, you can gain insights into which content types receive the most views and how often users return to those posts. This information is crucial for continuous improvement.
For example, if specific posts yield high impressions but low engagement, consider refining your content strategy to better align with audience interests.
Overall, impressions inform not just how visible your content is but also, with further analysis, guide your content creation process to meet user expectations better.
This strategic approach is vital for maintaining a relevant and engaging Facebook presence.
4. Click-Through Rate (CTR)
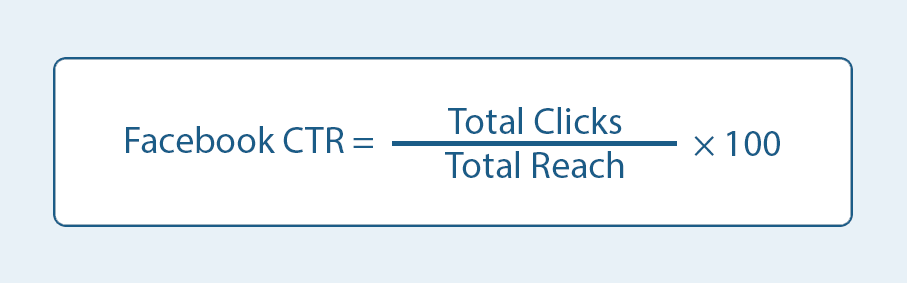
Click-through rate (CTR) is a crucial Facebook metric that measures the effectiveness of your content and ads in prompting user action. It quantifies the percentage of users who click on your posts relative to the total impressions.
CTR is an important indicator of how compelling your content is to your audience.
A high CTR generally signifies that your content resonates with users, encouraging them to take action. Conversely, a low CTR may indicate the content is not appealing or relevant to your audience.
By monitoring this metric, you can refine your marketing strategies to maximize engagement and conversion.
The Formula for Calculating CTR
To calculate CTR, use the following formula:
CTR=(Number of ClicksNumber of Impressions / Number of Impressions) × 100
This formula helps you understand the effectiveness of your posts and ads in capturing attention and driving action.
Implications of Ad Performance and Strategy Adjustments
Tracking CTR helps you evaluate the performance of individual posts and ad campaigns. A specific ad with a high CTR may indicate successful targeting or engaging content. Conversely, if the CTR is low, it could prompt you to reassess your ad copy, visuals, or target audience.
By continuously optimizing your strategies based on CTR, you can enhance overall campaign effectiveness and drive better results.
5. Page Likes and Followers Growth
Tracking page likes, and follower growth rates are essential for assessing the health and appeal of your Facebook presence.
Page likes represent the total number of users who have chosen to follow your page, while follower growth rates indicate how quickly your community is expanding or contracting.
Both metrics provide insights into brand affinity and audience engagement. A steady increase in page likes and followers often reflects an effective content strategy that resonates with your audience.
Importance of Follower Dynamics for Brand Affinity and Community Building
Understanding follower dynamics is vital for building a solid community around your brand. Increased page likes indicate a growing interest in your content, reinforcing brand loyalty.
A dedicated community engages with your posts and spreads word-of-mouth awareness, further amplifying your brand’s reach.
Conversely, declining follower counts can signal a need for content reevaluation. Regularly monitoring this metric allows you to fine-tune your strategy and maintain an engaged audience.
6. Follower Demographics
Analyzing follower demographics is crucial for effectively targeting specific audience segments. This data reveals who your followers are in terms of age, gender, location, and more.
Understanding these demographics enables you to tailor your content and marketing strategies to meet your audience’s preferences better.
Key Demographics to Monitor
Key demographics to focus on include:
- Age: Understanding the age range of your audience helps generate relevant content that resonates with different age groups.
- Gender: This data provides insights into content preferences and allows for targeted messaging.
- Location: Geographic data guides decisions regarding language, cultural references, and local interests.
Tailoring Content to Audience Preferences
Analyzing these demographics allows you to create content that speaks directly to your audience’s interests and needs.
For example, if a significant portion of your audience consists of younger users, you might focus on trends and topics that appeal to that demographic.
Utilizing tools like SocialBu, you can gain a comprehensive view of your follower demographics, helping you make informed decisions on content creation and marketing tactics.
This targeted approach enhances engagement and strengthens your connection with your followers.
7. Share of Voice
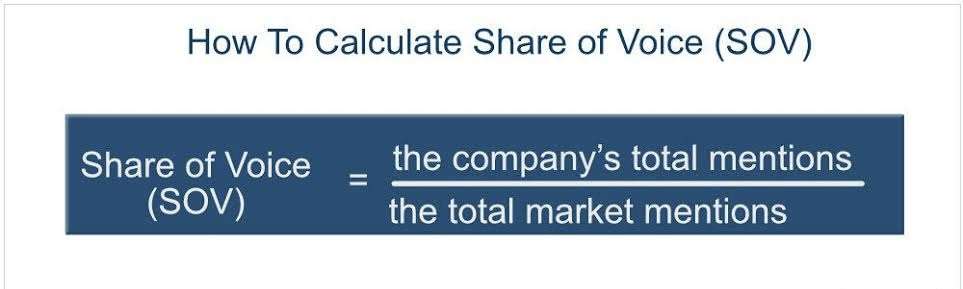
Share of Voice (SOV) is a critical marketing metric that measures your brand’s presence compared to competitors across social media platforms.
It reflects how much conversation about your industry or topic features your brand versus your competition.
A higher share of voice indicates that your brand has greater visibility and influence, which can lead to increased recognition and customer acquisition.
Understanding your share of voice is crucial for gauging brand visibility. If your brand consistently captures a higher share of the digital conversation, it suggests effective marketing strategies and resonates well with your target audience.
This metric offers insights into your brand’s positioning in the market, allowing you to evaluate whether you are leading the conversation or following behind competitors.
Importance of Tracking Share of Voice
Tracking the share of voice is essential for maintaining a competitive edge. It helps you monitor your brand’s reputation and engagement levels, offering insights into broader industry trends.
Regularly assessing your SOV can identify gaps in your strategy and capitalize on growth opportunities.
For example, if your competitors begin to dominate the conversation, you might need to refine your messaging or increase engagement efforts.
This allows for quick comparisons and informed decision-making to enhance your market presence.
8. Video Views and Engagement
Video content is a powerful tool on Facebook. Tracking video views is crucial for assessing the effectiveness of your video marketing efforts.
This metric tells you how often users have viewed your videos, giving you insight into audience interest and engagement levels with your visual content.
High view counts typically indicate that your videos capture audience attention, vital for driving brand awareness and nurturing customer relationships.
Consequently, focusing on this metric helps inform your content creation strategy, guiding you in producing more engaging video content that resonates with your audience.
Video Engagement Metrics, Including Audience Retention
In addition to views, monitoring video engagement metrics is equally essential. Engagement metrics include likes, shares, comments, and, most critically, audience retention.
Audience retention measures how much of your video viewers watched before dropping off.
Analyzing retention rates can help you understand at what point viewers lose interest.
If you notice significant drop-offs at specific times in your videos, it could indicate that the content needs to be more engaging or concise.
This insight allows you to refine your video strategy, ensuring that future content maintains viewer interest from start to finish.
9. Cost Per Click (CPC) and Cost Per Thousand Impressions (CPM)
 Cost Per Click (CPC) and Cost Per Thousand Impressions (CPM) are important metrics within the Facebook ads metrics list.
- CPC measures the price you pay for each click on your ad, representing the cost-effectiveness of your ad campaigns. It helps determine how well your ads generate interest and engagement from users.
- Conversely, CPM calculates the total cost of your ads per thousand impressions, helping you understand the cost of running ads with their visibility. This metric is beneficial for brand awareness campaigns focused on reaching large audiences.
Significance of Monitoring CPC and CPM
Monitoring CPC and CPM is critical for optimizing ad spend. By analyzing these financial metrics, you gain insights into the efficiency and effectiveness of your advertising budget.
High CPCs may suggest that your targeting or ad quality needs improvement, while low CPMs could indicate successful broad visibility at a reasonable cost.
Conclusion
Understanding and leveraging the critical Facebook metrics is essential for any business.
This knowledge empowers businesses to refine content strategies, enhance interaction levels, and optimize ad spending effectively.
As you implement these strategies, you can enhance brand visibility and foster deeper connections with your audience.
The metrics discussed here provide a comprehensive roadmap to navigate the complexities of social media marketing.
Start using SocialBu to effortlessly track your important Facebook metrics and gain actionable insights that can drive your success. Experience the difference today.
FAQs
1. What metrics matter on Facebook?
The most important Facebook metrics to track include engagement rate, reach, impressions, click-through rate (CTR), page likes and followers growth, and video views. These metrics provide insights into audience interactions, content visibility, and overall performance of brand strategies.
2. What is a KPI for Facebook?
Key Performance Indicators (KPIs) for Facebook are specific metrics used to measure the effectiveness of marketing efforts. Common KPIs include engagement rate, reach, impressions, and conversion rates, which help gauge the success of advertising and content strategies.
3. How do we measure Facebook performance?
To measure Facebook performance, utilize Facebook Insights or analytics tools to track key metrics such as engagement, reach, and follower dynamics. Regularly assess these metrics to identify trends and areas for improvement in your marketing strategy.
4. What metrics does Meta use?
Meta uses various metrics for its platform, including engagement metrics (likes, comments, shares), reach (unique views), impressions (total views), click-through rates (CTR), and audience demographics, to comprehensively assess user interaction and content effectiveness.
5. How do we analyze Facebook engagement?
To analyze Facebook engagement, review metrics such as likes, shares, comments, and click-through rates. Utilize Facebook Insights to track these metrics over time, identify high-performing content, and understand audience preferences for optimizing future posts.
6. How do I check Facebook quality?
To check Facebook quality, examine several performance metrics, including engagement rates, audience feedback (comments and reactions), and follower growth trends. Additionally, monitor sentiment analysis to gauge how users perceive your brand on the platform.