Publishing on social media without tracking performance is like running ads with no conversion data; you’re spending time and budget with no feedback loop.
In 2026, social media publishing analytics have become a core business function, not an afterthought. Brands that measure rigorously are the ones growing consistently, because they know exactly which content drives results and which doesn’t.
This guide covers everything you need to track social media content performance the right way, from choosing the right social media KPIs and setting up UTM tracking to using the best social media performance-tracking tools and building reports your team and clients actually trust.
Whether you’re a marketer, an agency, or a brand managing multiple platforms, you’ll find a practical, step-by-step framework here.
Let’s get into it.
TL;DR
Track social media publishing performance by setting clear KPIs (engagement rate, reach, CTR, conversions), using UTM parameters to tie posts to business outcomes, and reviewing data in a centralized analytics dashboard; weekly for pulse checks, monthly for strategy. Native platform analytics show you raw numbers; third-party tools like SocialBu show you the full picture.
![]()
Why Does Social Media Publishing Performance Tracking Matter in 2026?
Tracking social media publishing performance is the difference between a strategy that grows and one that guesses. Without measurement, you’re publishing blindly, spending time and budget on content that may be producing zero real results.
The stakes are higher than ever. Social media algorithms in 2025-2026 have collectively shifted from social-graph distribution to interest-graph distribution, meaning content performance now depends less on your follower count and more on engagement velocity within the first 30-60 minutes. If you’re not tracking that window, you’re missing your most critical optimization signal.
Social media publishing performance tracking gives you the data to justify your budget, improve content quality, understand what your audience actually wants, and connect publishing activity to real business outcomes such as leads, sales, and brand awareness. Without it, you’re one algorithm change away from being invisible.
What Are the Most Important Social Media KPIs to Track?
Social media KPIs are the specific metrics that tell you whether your publishing is achieving your goals. The right KPIs depend on your objectives, but every strategy needs a core set of measurable signals.
Here are the primary social media metrics to track:
KPI Category | Metric | What It Measures |
Reach & Visibility | Organic reach, Impressions | How many unique people see your content vs. how many total views |
Engagement | Engagement rate, Likes, Comments, Shares, Saves | How actively your audience interacts with each post |
Audience Growth | Follower growth rate, Net new followers | Whether your content is attracting a larger audience over time |
Traffic | Click-through rate, Link clicks | How effectively do posts drive users to your website or landing pages |
Conversions | Leads, Sign-ups, Purchases, Demo requests | Whether social traffic takes a meaningful business action |
Brand Awareness | Mentions, Share of voice, Branded searches | How widely your brand is being discussed and discovered |
Content Performance | Best performing posts, Format breakdown | Which content types, topics, and formats drive the most results |
ROI | Revenue attributed to social, Cost per lead | The actual financial return from your social media investment |
What’s the Difference Between Reach vs. Impressions?
Reach counts unique viewers (how many different people saw your post). Impressions count total views, including repeat views from the same person. Both matter: high impressions with low reach mean you’re reaching the same people repeatedly. High reach with low impressions may indicate your content wasn’t compelling enough to prompt a second look.
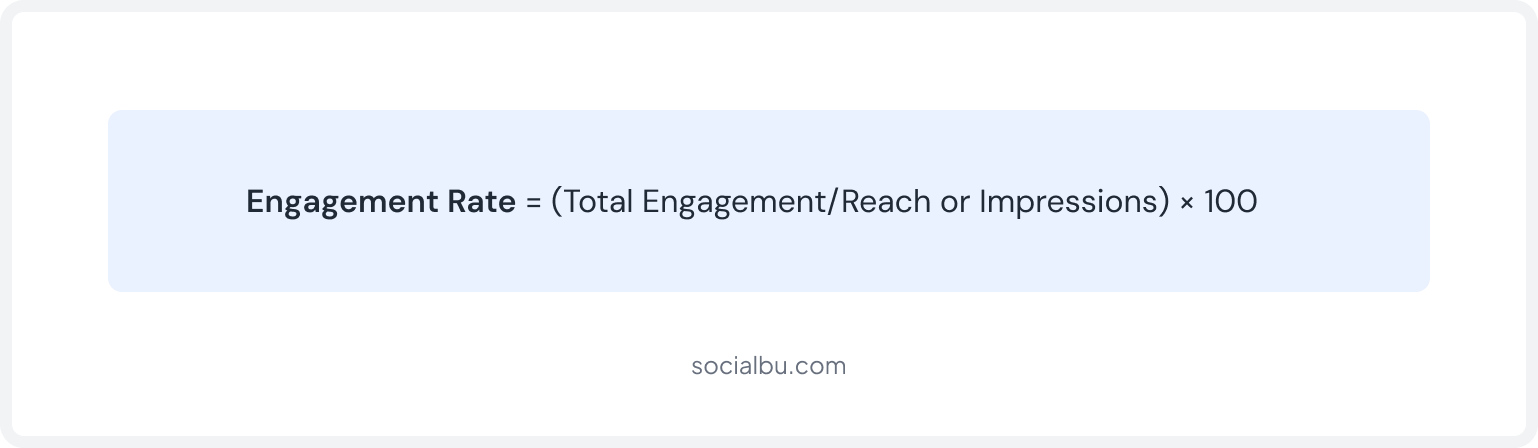
What Does “Engagement Rate” Actually Mean?
Engagement rate is the percentage of people who interacted with your content out of those who saw it. It’s one of the most important social media metrics because it signals whether your content is relevant and compelling, not just seen.
Which Social Media Metrics Should You Track by Goal?
The most common mistake in social media performance reporting is tracking everything. Not every metric matters for every objective. Here’s how to match metrics to goals:
Your Goal | Primary Metrics | Secondary Metrics |
Brand Awareness | Reach, Impressions, Follower growth | Mentions, Share of voice, Video views |
Engagement & Community | Engagement rate, Comments, Shares, Saves | DM replies, Story reactions, Polls participation |
Website Traffic | Link clicks, CTR, Referral traffic | Bounce rate, Pages per session from social |
Lead Generation | Conversions, Form fills, UTM-tracked sign-ups | Cost per lead, Lead quality score |
Sales/E-commerce | Social-attributed revenue, ROAS | Add-to-cart clicks, Checkout completions |
Content Performance | Post engagement rate, Format performance | Best time to post, Top-performing topics |
Agency Client Reporting | All of the above, custom KPI dashboards | Competitive benchmarks, MoM growth |
Pro Tip
For Saas Businesses, track trial sign-ups and demo requests driven by social traffic. For agencies, build per-client dashboards that show goal-specific KPIs rather than generic vanity metrics.
How Do You Track Social Media Performance Across Platforms & Website Conversions?
Monitoring social media publishing metrics effectively requires a three-layer approach: native platform analytics for raw data, UTM parameters to attribute traffic, and Google Analytics 4 to connect it all to business outcomes. Here’s how each layer works:
1. Using Native Platform Analytics
Every major social media platform provides built-in analytics. These native tools are free, real-time, and the most accurate source of raw data for their respective platforms. Here’s what each offers:
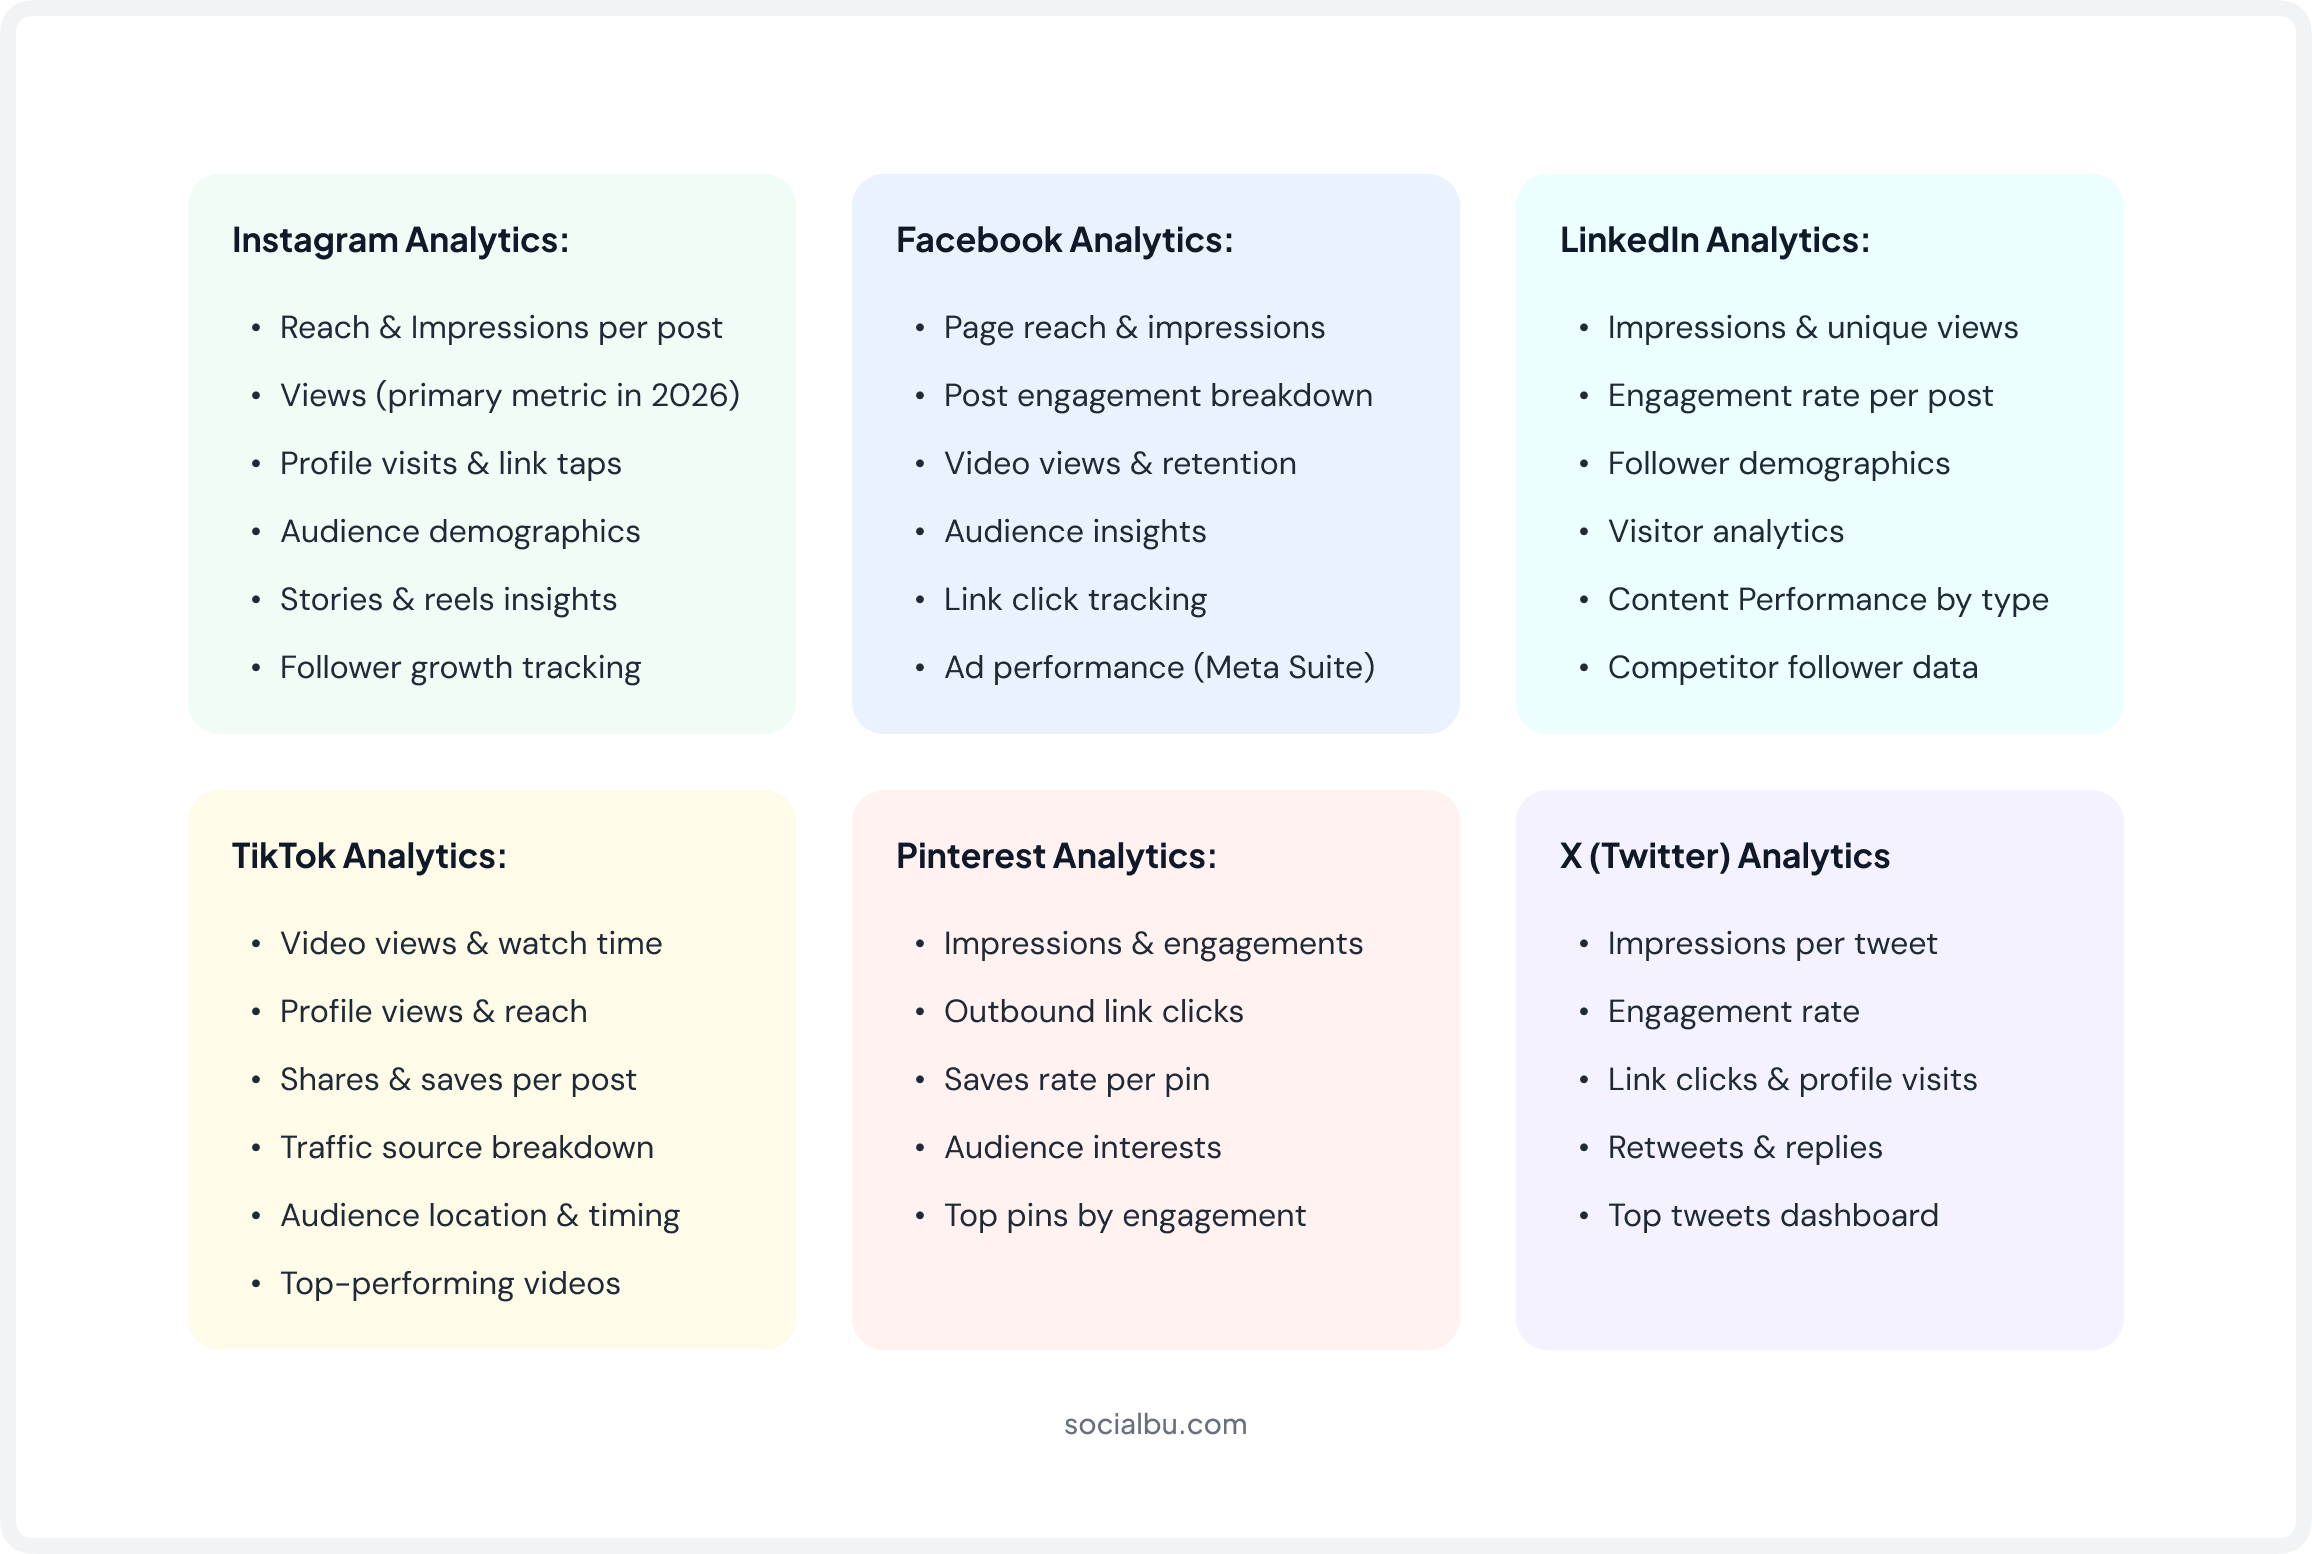
Limitations: You have to log in to each platform separately, data formats differ, there’s no cross-platform comparison view, and historical export windows are often restricted. This is why third-party tools, especially platforms like SocialBu, become essential when you’re managing multiple accounts.
UTM data & post performance — all in one place.
Stop jumping between tabs. SocialBu connects everything so you can actually act on your data.
2. Using UTM Parameters
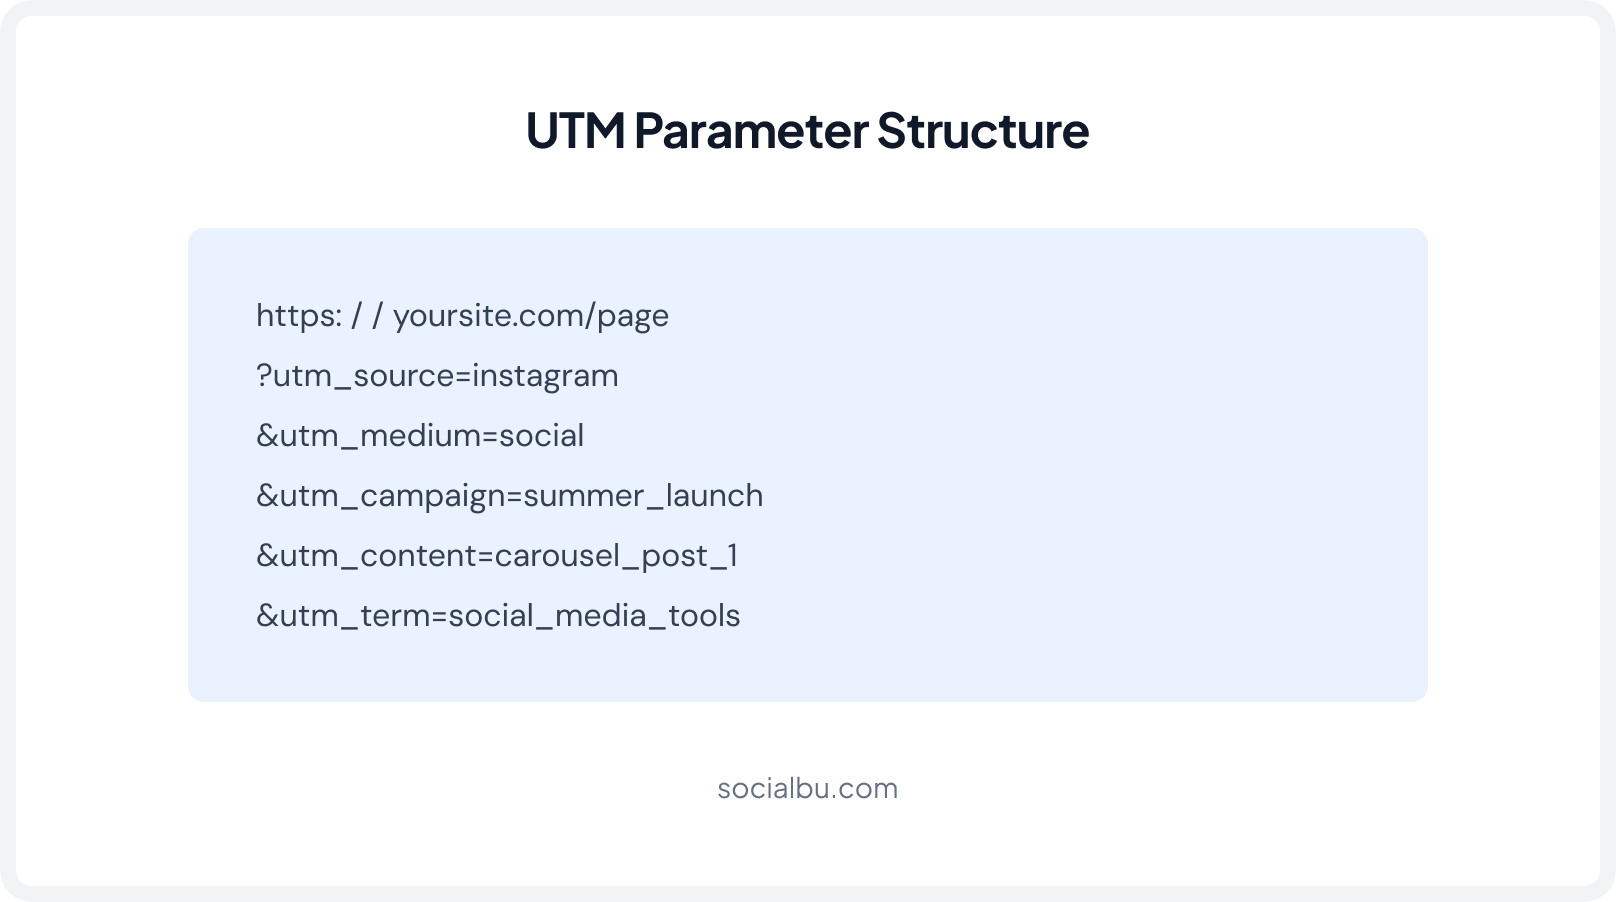
UTM tracking for social media is the single most important tool for connecting social media publishing to real business outcomes. UTM parameters are small tags you add to URLs that tell Google Analytics, or any other analytics platform, exactly where a visitor came from and what content sent them.
Without UTMs, your analytics show traffic from “social media.” With UTMs, you can see that this specific LinkedIn post about your new feature drove 47 trial sign-ups on Tuesday. That’s the difference between fuzzy data and actionable insight.
What Are the 5 UTM Parameters You Need to Know?
- utm_source: The platform (Instagram, LinkedIn, TikTok, Facebook)
- utm_medium: The channel type (social, organic_social, paid_social)
- utm_campaign: The specific campaign or initiative (q3_product_launch)
- utm_content: The specific post or creative variant (carousel_v2, video_30s)
- utm_term: Uses for paid social targeting keywords (optional or organic)
Pro Tip
Build a UTM naming convention and stick to it. Use lowercase consistently, avoid spaces, and document your convention in a shared spreadsheet. Inconsistent UTM naming fractures your data across multiple rows in Google Analytics, making campaign analysis nearly impossible.
3. Measuring Traffic & Conversions with GA4
Google Analytics social media traffic measurement becomes powerful once UTMs are in place. Google Analytics (GA4) lets you filter all sessions by source, medium, or campaign. You can see exactly how many users came from a specific post, what pages they visited, how long they stayed, and whether they converted.
This is how you calculate true social media ROI, not impressions or likes, but actual business outcomes.
Conversion Tracking with Meta Pixel & LinkedIn Insight Tag
To go deeper: install the Meta Pixel for Facebook and Instagram campaigns, and the LinkedIn Insight Tag for LinkedIn. These track what users do on your site after clicking from a social post, enabling conversion tracking even for users who don’t immediately sign up but return later.
What Are the Best Social Media Performance Tracking Tools in 2026?
Third-party social media analytics tools consolidate data across platforms, automate reporting, and surface insights that native tools simply can’t provide on their own. Instead of logging into six different dashboards every morning, these tools give you one unified view of your entire publishing performance.
Here are the top tools for social media publishing performance tracking in 2026:
1. SocialBu
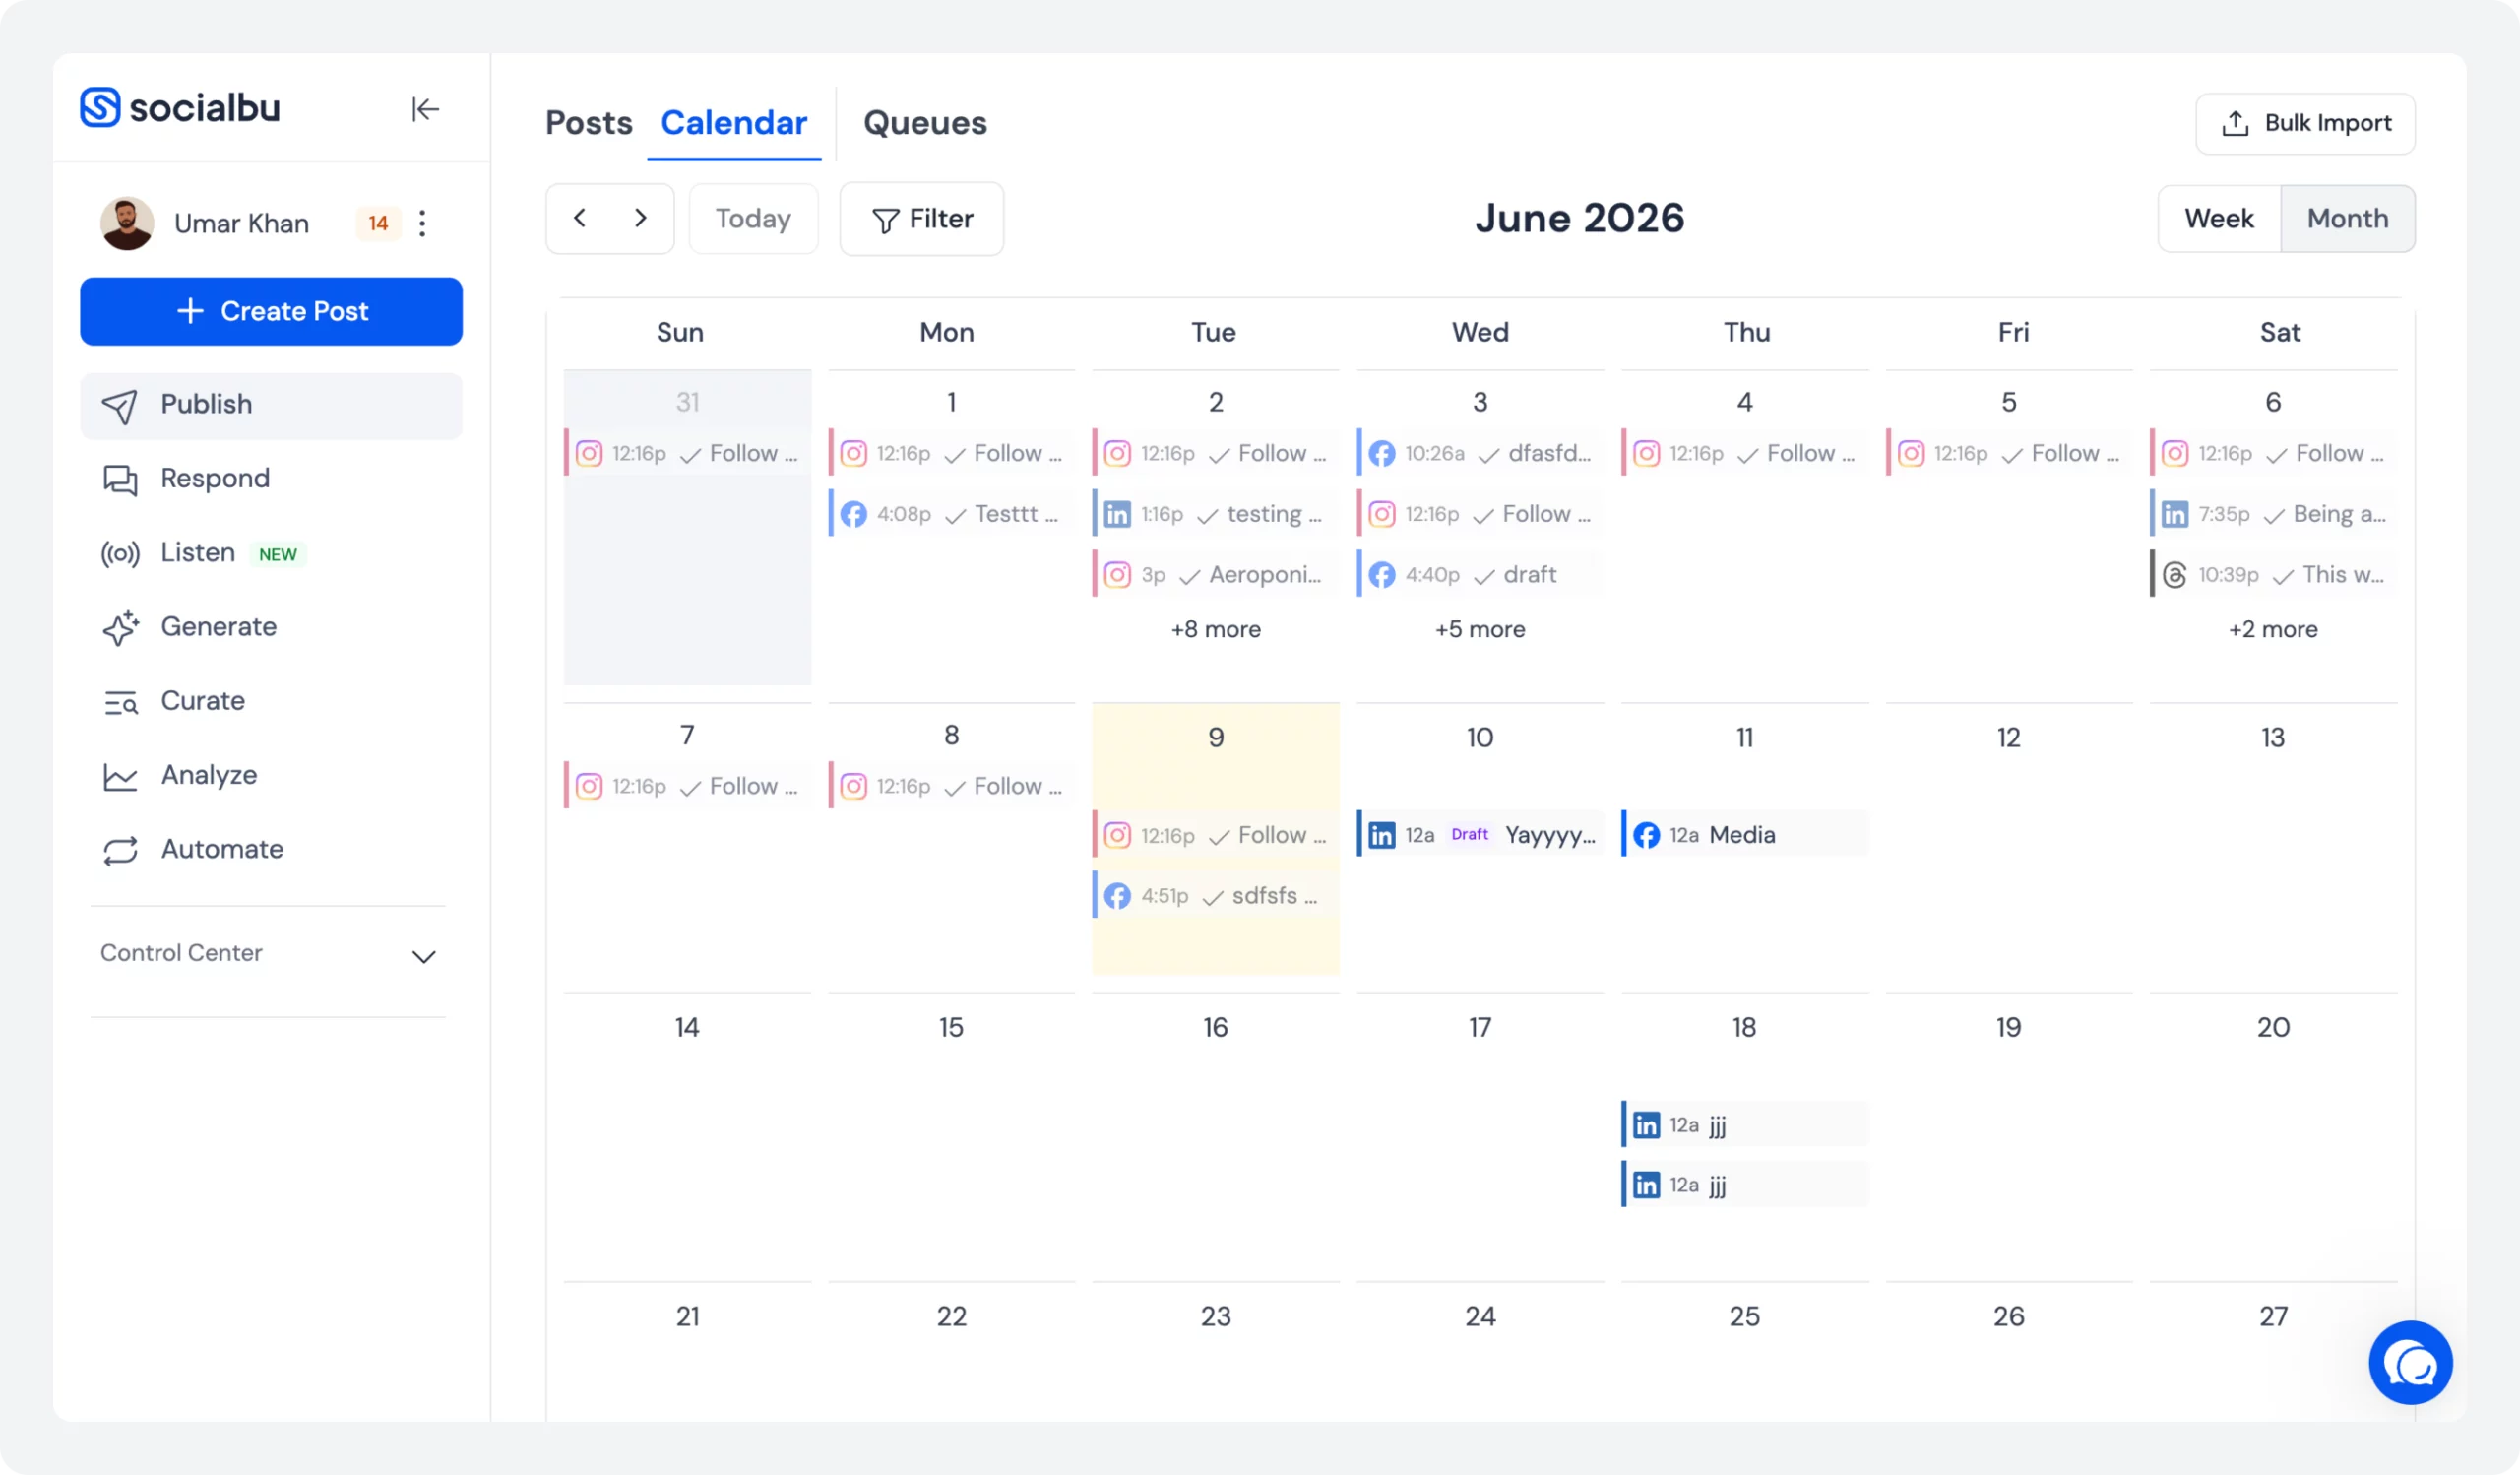
SocialBu is the most complete social media performance-tracking tool for teams that want publishing, scheduling, and analytics all under one roof. It supports Facebook, Instagram, LinkedIn, Twitter/X, and more.
What makes SocialBu stand out is that its analytics layer is directly connected to your publishing workflow; so you don’t just see what was posted, you see how each post performed in context. From a unified social media analytics dashboard to customizable reports, follower growth tracking, and real engagement alerts.
SocialBu gives you everything needed to measure, report, and improve social media publishing results without switching between tools. It’s especially powerful for agencies managing multiple client accounts who need white-label reporting and per-client KPI dashboards.
2. Metricool
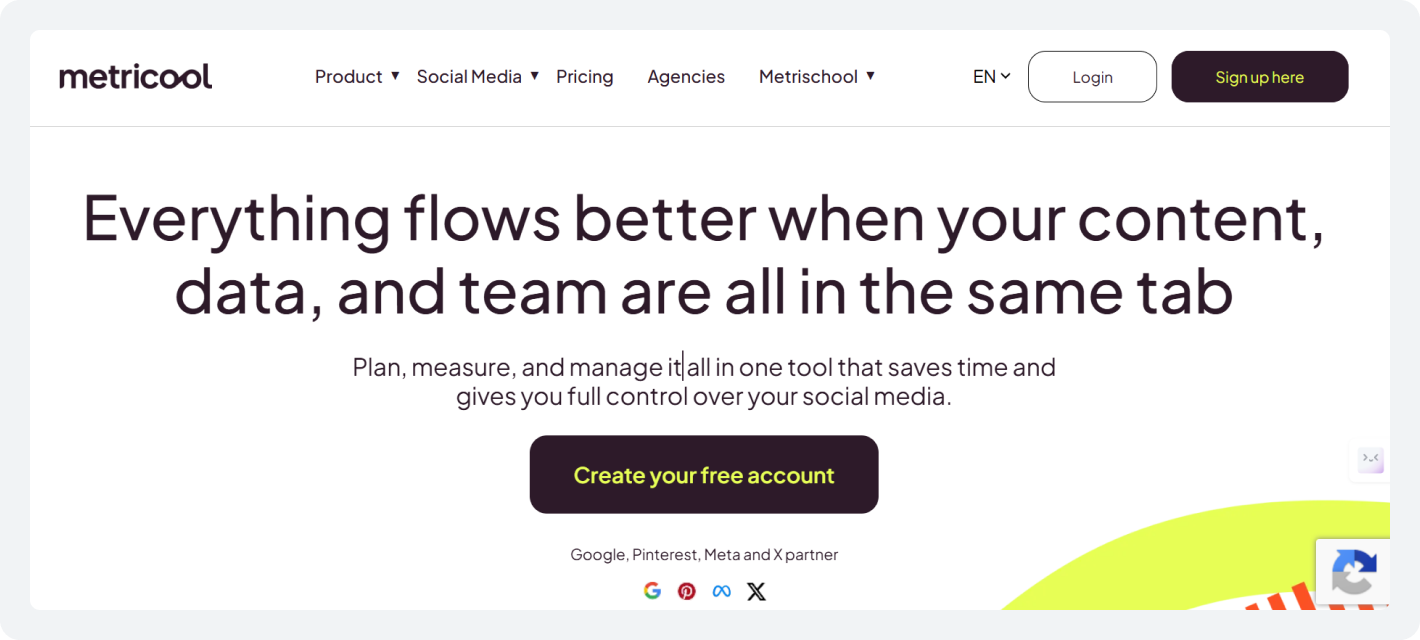
Metricool is a strong choice for agencies and multi-brand managers who need cross-platform analytics paired with scheduling capabilities. Its analytics cover Instagram, Facebook, LinkedIn, TikTok, Twitter/X, and multiple other platforms, all in a single dashboard.
Metricool analytics are particularly useful for competitor tracking, letting you benchmark your engagement rate and follower growth directly against rivals. It also supports white-label PDF reports, making it a popular pick for social media reporting for agencies and clients.
The auto-scheduling integration ensures your content calendar performance data is always directly tied to publishing history.
3. Later
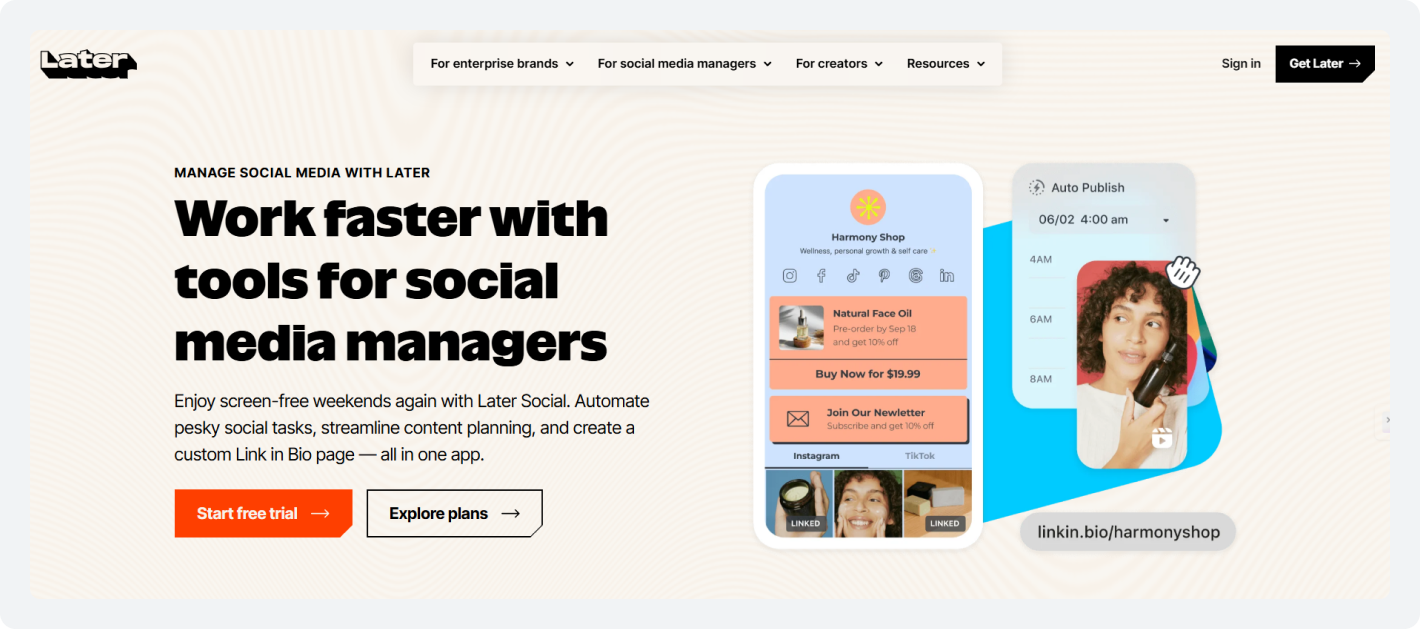
Later is well known as a visual content scheduler, but its analytics features are genuinely useful, especially for Instagram-heavy strategies. It provides post-performance data, best-time-to-post recommendations based on your audience’s actual behavior, and link-in-bio click tracking that helps you measure social media conversion without leaving the platform.
For brands focused on organic reach tracking and community growth on Instagram, Later’s analytics give clear, visual reports that are easy to interpret and share. It also supports analytics for Facebook, TikTok, LinkedIn, and Pinterest, though Instagram remains its strongest suit.
4. Planoly
Planoly is a visual social media planner with built-in analytics designed for Instagram and Pinterest. Its analytics focus on content performance, helping you identify which post formats, captions, and hashtags generate the most engagement and reach.
Planoly’s analytics include engagement rate breakdowns, follower growth charts, and insights into top-performing posts, making it useful for brands that rely heavily on visual content.
For Pinterest specifically, Planoly gives you impression, save, and click data that most other tools don’t break out clearly, making it one of the better Pinterest analytics tools available for content-first brands.
5. Sendible
Sendible is built with agencies firmly in mind. It offers a full reporting suite that covers social media performance reporting for multiple clients simultaneously, including customizable white-label reports, automated report delivery via email, and detailed post-level analytics across all major platforms.
Sendible integrates with Google Analytics to bring social traffic and conversion data into the same report, which is invaluable for showing clients the direct business impact of social publishing.
It also includes social listening, brand monitoring, and sentiment tracking, making it a comprehensive solution for agencies that need both publishing and social media attribution tracking on a single platform.
What Should You Look for In a Social Media Analytics Tool?
With so many options available, choosing the right tool comes down to a few non-negotiable capabilities. Here’s what to evaluate:
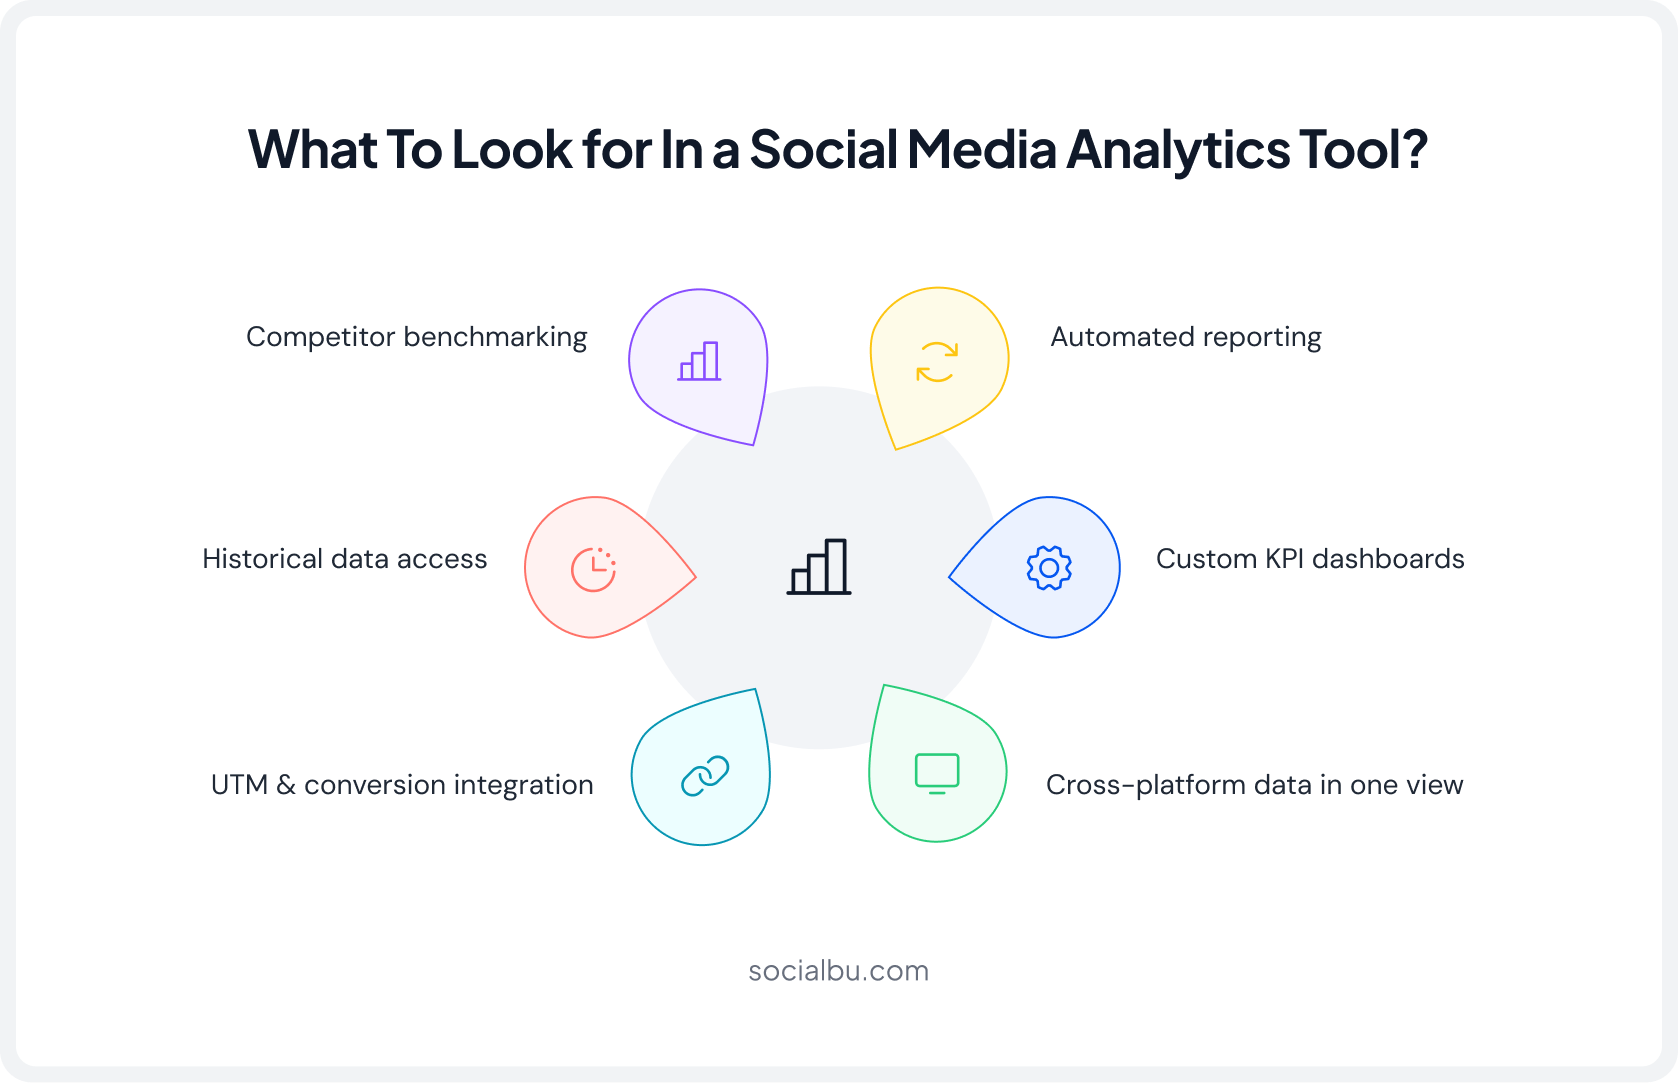
1. Cross-Platform Data in One View
Your tool should aggregate metrics from every active platform into a single dashboard. Logging into six separate native tools defeats the purpose of social media publishing performance tracking and makes cross-platform comparison nearly impossible.
2. Historical Data Access
Native platform analytics often cap historical data at 28-90 days. A good third-party tool retains longer data windows, which is essential for spotting long-term trends in follower growth tracking, seasonal engagement patterns, and content format performance over time.
3. Automated Reporting
Weekly and monthly reports should go out automatically, not require someone to manually pull and format data every time. Automated reporting is a core requirement for agencies managing multiple clients and for in-house teams presenting to leadership on a regular rhythm.
4. Custom KPI Dashboards
Different businesses track different things. A SaaS company’s primary KPI might be demo sign-ups from social; an e-commerce brand cares about revenue attribution. Your analytics tool should let you build dashboards around your goals, not force you into a generic default layout.
5. Competitor Benchmarking
Understanding your own data is only half the picture. The best social media reporting tools let you compare your engagement rate, posting frequency, and follower growth against competitors, so you know whether you’re leading or lagging in your industry.
6. UTM & Conversion Integration
The tool should connect post-level publishing data to website conversions via UTM tracking and Google Analytics integration. Without this bridge, you can’t accurately track social media ROI or demonstrate the revenue impact of your content.
How Does SocialBu Help You Track Social Media Publishing Performance?
SocialBu is one of the most complete social media management platforms for tracking publishing performance, built specifically for businesses and agencies that need real data, not just vanity metrics.
What sets SocialBu apart is that it connects the full publishing workflow, scheduling, auto-publishing, content calendar, and engagement directly to its analytics layer. You don’t just see what you posted; you see how each post performed, in context, across all your connected platforms.
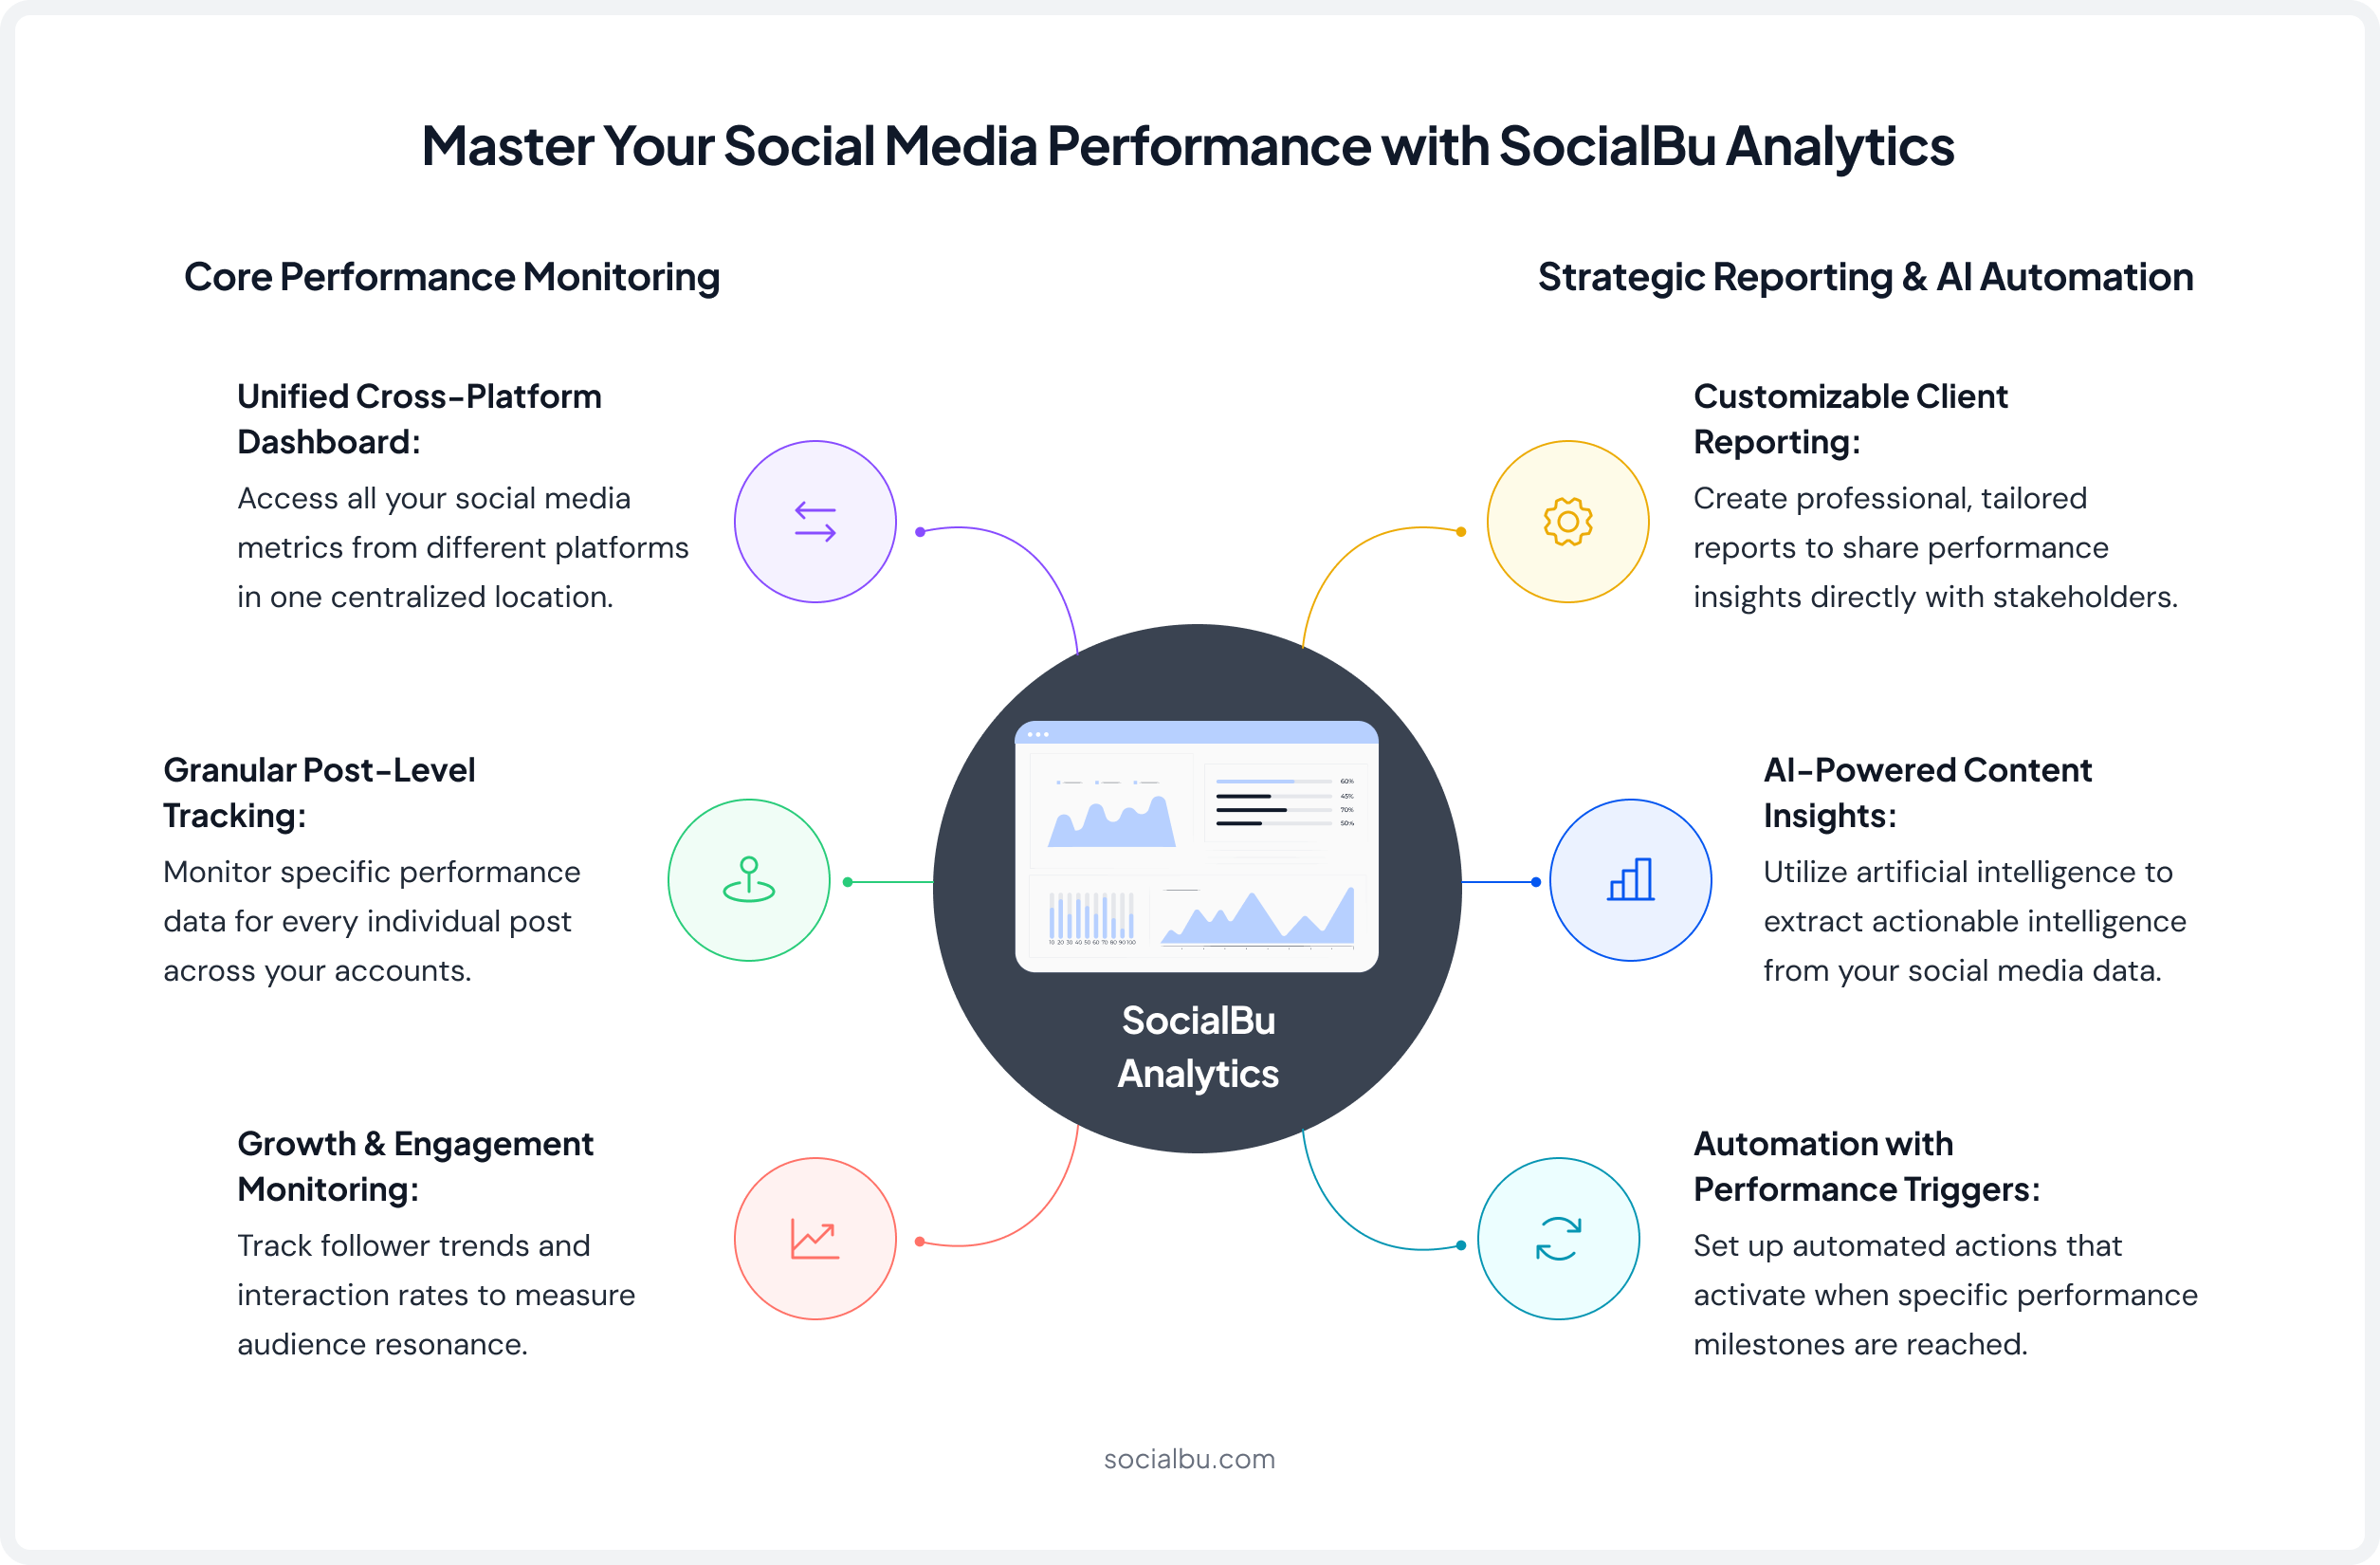
Key Analytics Features
Here are the key analytics features SocialBu offers that help you track social media publishing performance:
1. Unified Cross-Platform Analytics Dashboard
SocialBu aggregates metrics from all your connected profiles into one clean, customizable social media analytics dashboard. You can configure widgets to track the specific KPIs that matter to your strategy, whether that’s engagement rate, reach, follower growth, or conversions. No more toggling between platform tabs to piece together a picture.
2. Post-Level Performance Tracking
Every published post gets its own performance data, i.e., reach, impressions, engagement rate, clicks, and interactions, all accessible in one place. This makes social media post performance analysis fast and accurate. You can sort and filter by top performers to identify your best-performing content across formats and platforms.
3. Follower Growth Tracking
SocialBu tracks audience growth trends over time across all connected profiles, with timeline charts that help you correlate growth spikes with specific content or campaigns. Consistent follower growth tracking is critical for understanding whether your publishing strategy is genuinely building an audience or just spinning its wheels with existing followers.
4. Engagement Rate Monitoring
Track how your engagement rate social media benchmarks shift week over week and month over month. SocialBu surfaces real-time alerts when performance dips or spikes unexpectedly, so you can act on opportunities or investigate problems before they compound. This is especially useful for agencies monitoring multiple client accounts simultaneously.
5. Content Calendar Performance Review
SocialBu overlays performance data directly onto your content calendar, making it easy to see which posting days, times, and frequencies generate the best results. This built-in content calendar performance review eliminates the guesswork from scheduling decisions and helps you refine your publishing flow based on evidence rather than instinct.
6. Customizable Client Reporting
Build fully customizable reports with clear charts, graphs, and KPI comparisons, then export or schedule them for automatic delivery. This is SocialBu’s standout feature for social media reporting for agencies and clients. Reports can be tailored per client, per campaign, or per goal, giving stakeholders the metrics they actually care about rather than a one-size-fits-all data dump.
7. AI-Powered Content Insights
SocialBu uses AI to surface patterns in your top-performing posts and suggest content improvements. Rather than manually digging through months of data to identify what’s working, SocialBu’s AI layer does the content performance analysis for you, helping you replicate successful content systematically and reduce the time spent on trial-and-error publishing.
8. Automation with Performance Triggers
Set up smart automations that respond to performance signals in real time. For example, when a post surpasses a certain engagement threshold, SocialBu can automatically trigger a follow-up action, like resharing the content or notifying your team. This closes the loop between social media data tracking and actual publishing decisions, making your workflow genuinely data-driven.
Who Should Use SocialBu?
Audience | Why SocialBu Fits |
Small to Medium Businesses | 3–10 social profiles, consolidated analytics without enterprise pricing; the same quality of social media publishing analytics larger teams get, at SMB cost. |
Agencies | Multi-account management, role-based access, customizable white-label reporting; purpose-built for social media performance for agencies. |
SaaS Companies | UTM integration and post-level analytics to track trial sign-ups, demo requests, and free-to-paid conversions from social, not just likes. |
E-commerce Brands | Link tracking + UTM integration to see exactly which posts drove revenue, supporting complete social media performance for ecommerce analysis. |
Real User Feedback
“SocialBu is my go-to solution, solving the headaches I faced in making sure my posts and my clients’ are consistently published across all social media platforms.” (SelectHub)
You know what to track. Now get a tool for it.
SocialBu shows you which posts drove results, when to publish, and what to do next.
How Should You Build Effective Social Media Performance Reports?
A social media performance report turns raw data into decisions. Whether you’re reporting to a client, a CMO, or reviewing your own strategy, the format matters as much as the numbers.
Weekly Reporting Framework
Use a weekly social media report for pulse checks and quick optimization. It should include:
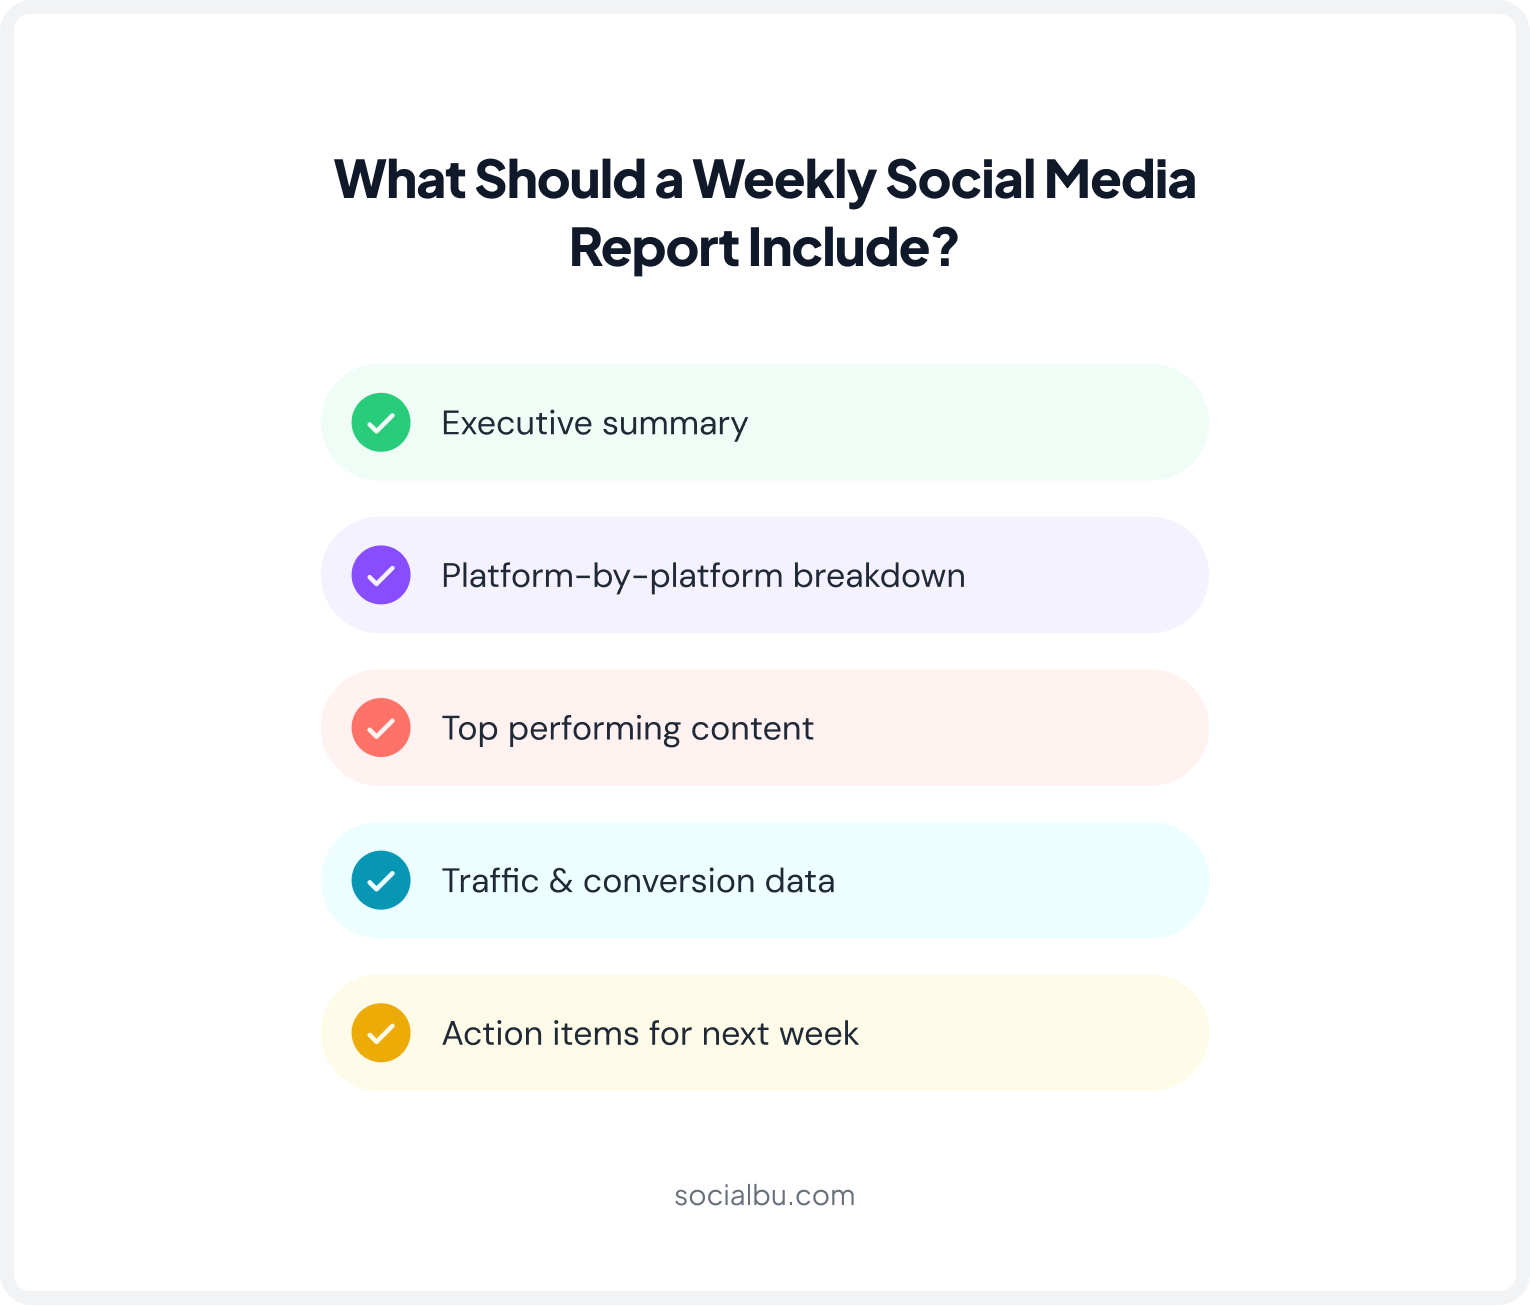
- Executive Summary: 3-5 bullet points summarizing the week’s top performance highlights, wins, and any notable dips.
- Platform-by-Platform Breakdown: Report reach, engagement rate, follower change, and top post for each active platform. Use a consistent table format for easy week-over-week comparison.
- Top Performing Content: Highlight the 2-3 best-performing posts of the week with their metrics. Note what made them perform well: format, topic, timing, and creative element.
- Traffic & Conversion Data: Pull UTM-tracked sessions and conversions from Google Analytics. Show how social traffic translates into website visits, sign-ups, or sales.
- Action Items for Next Week: Close every report with 2-3 concrete recommendations based on the data.
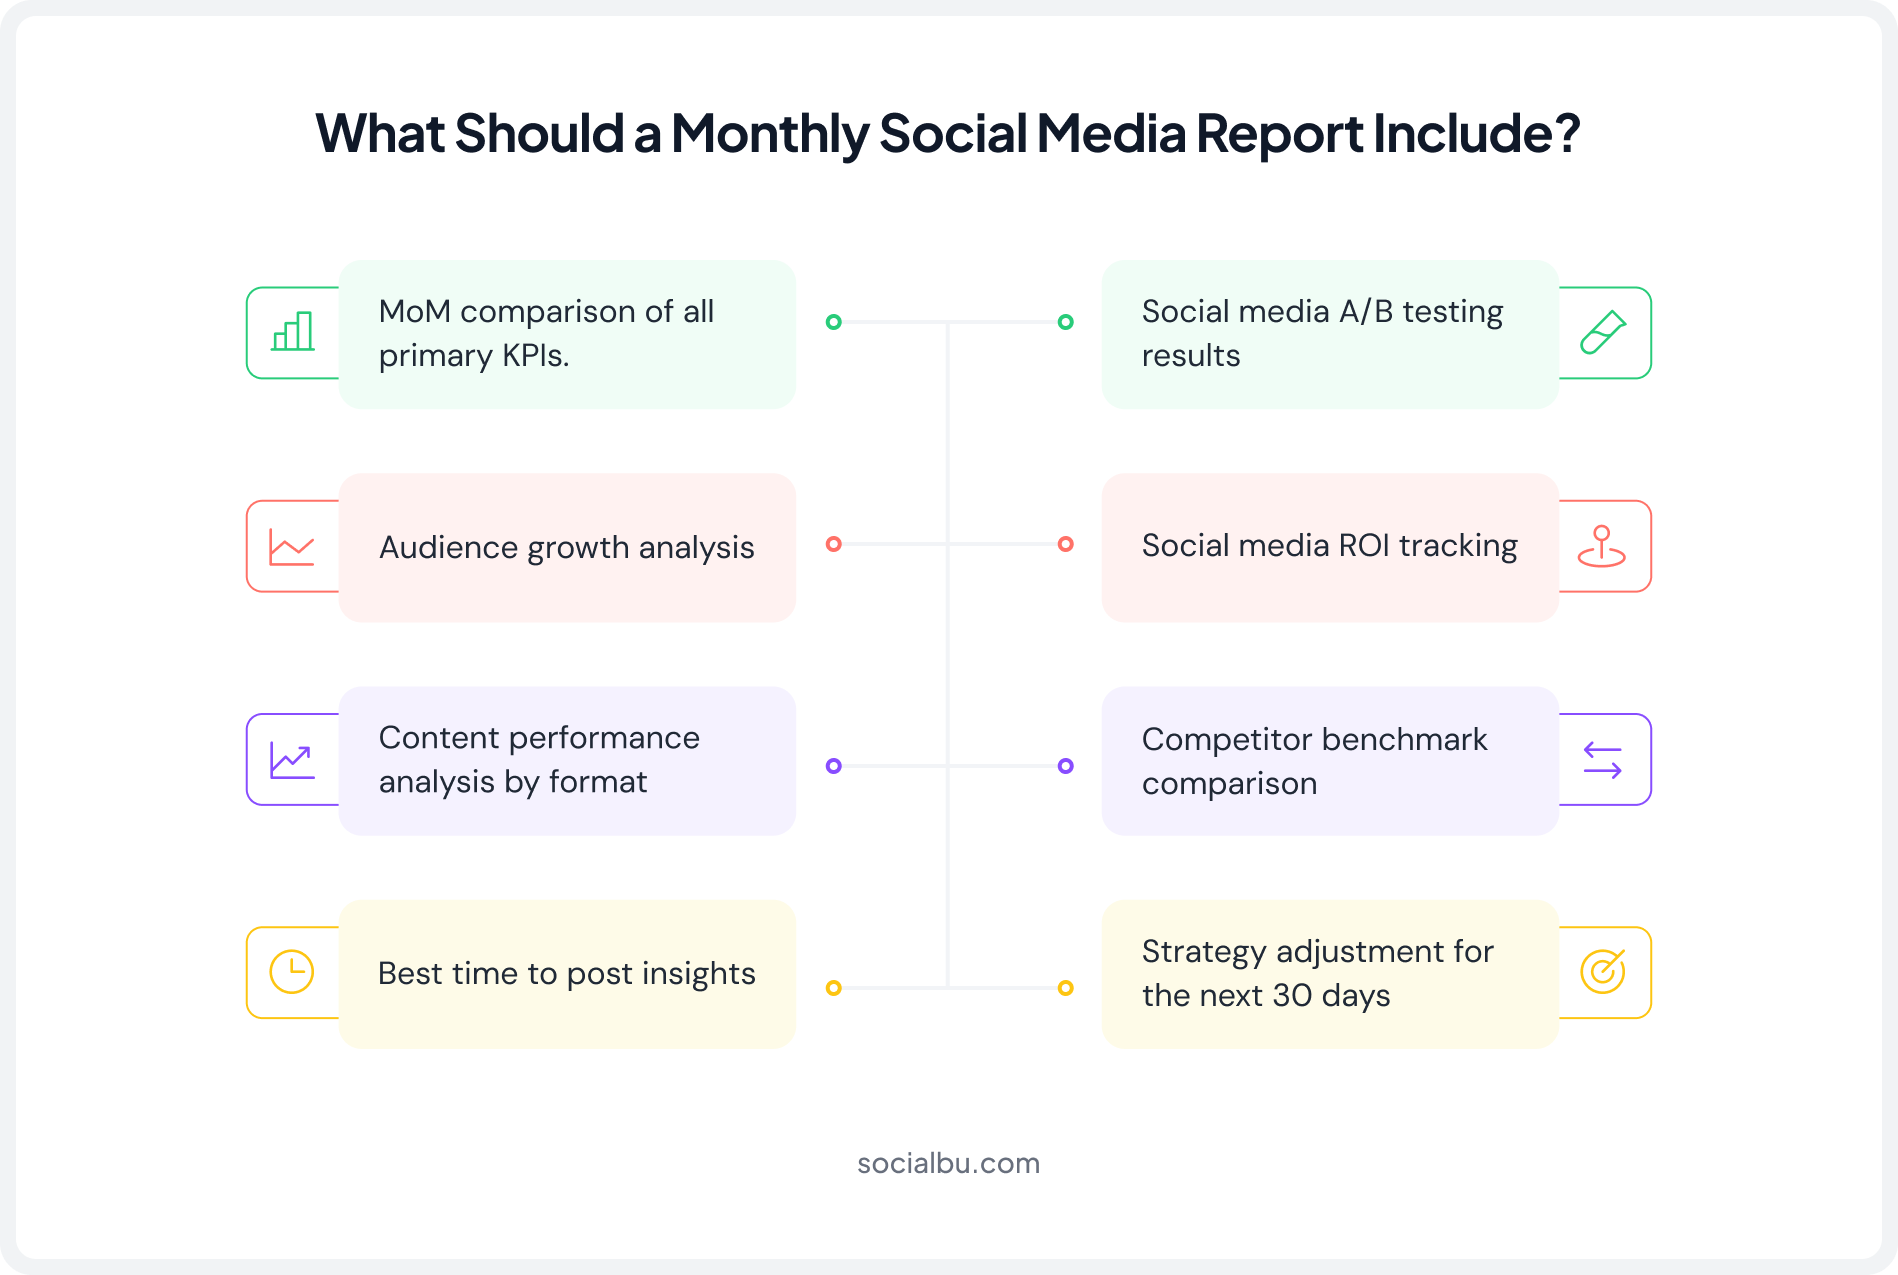
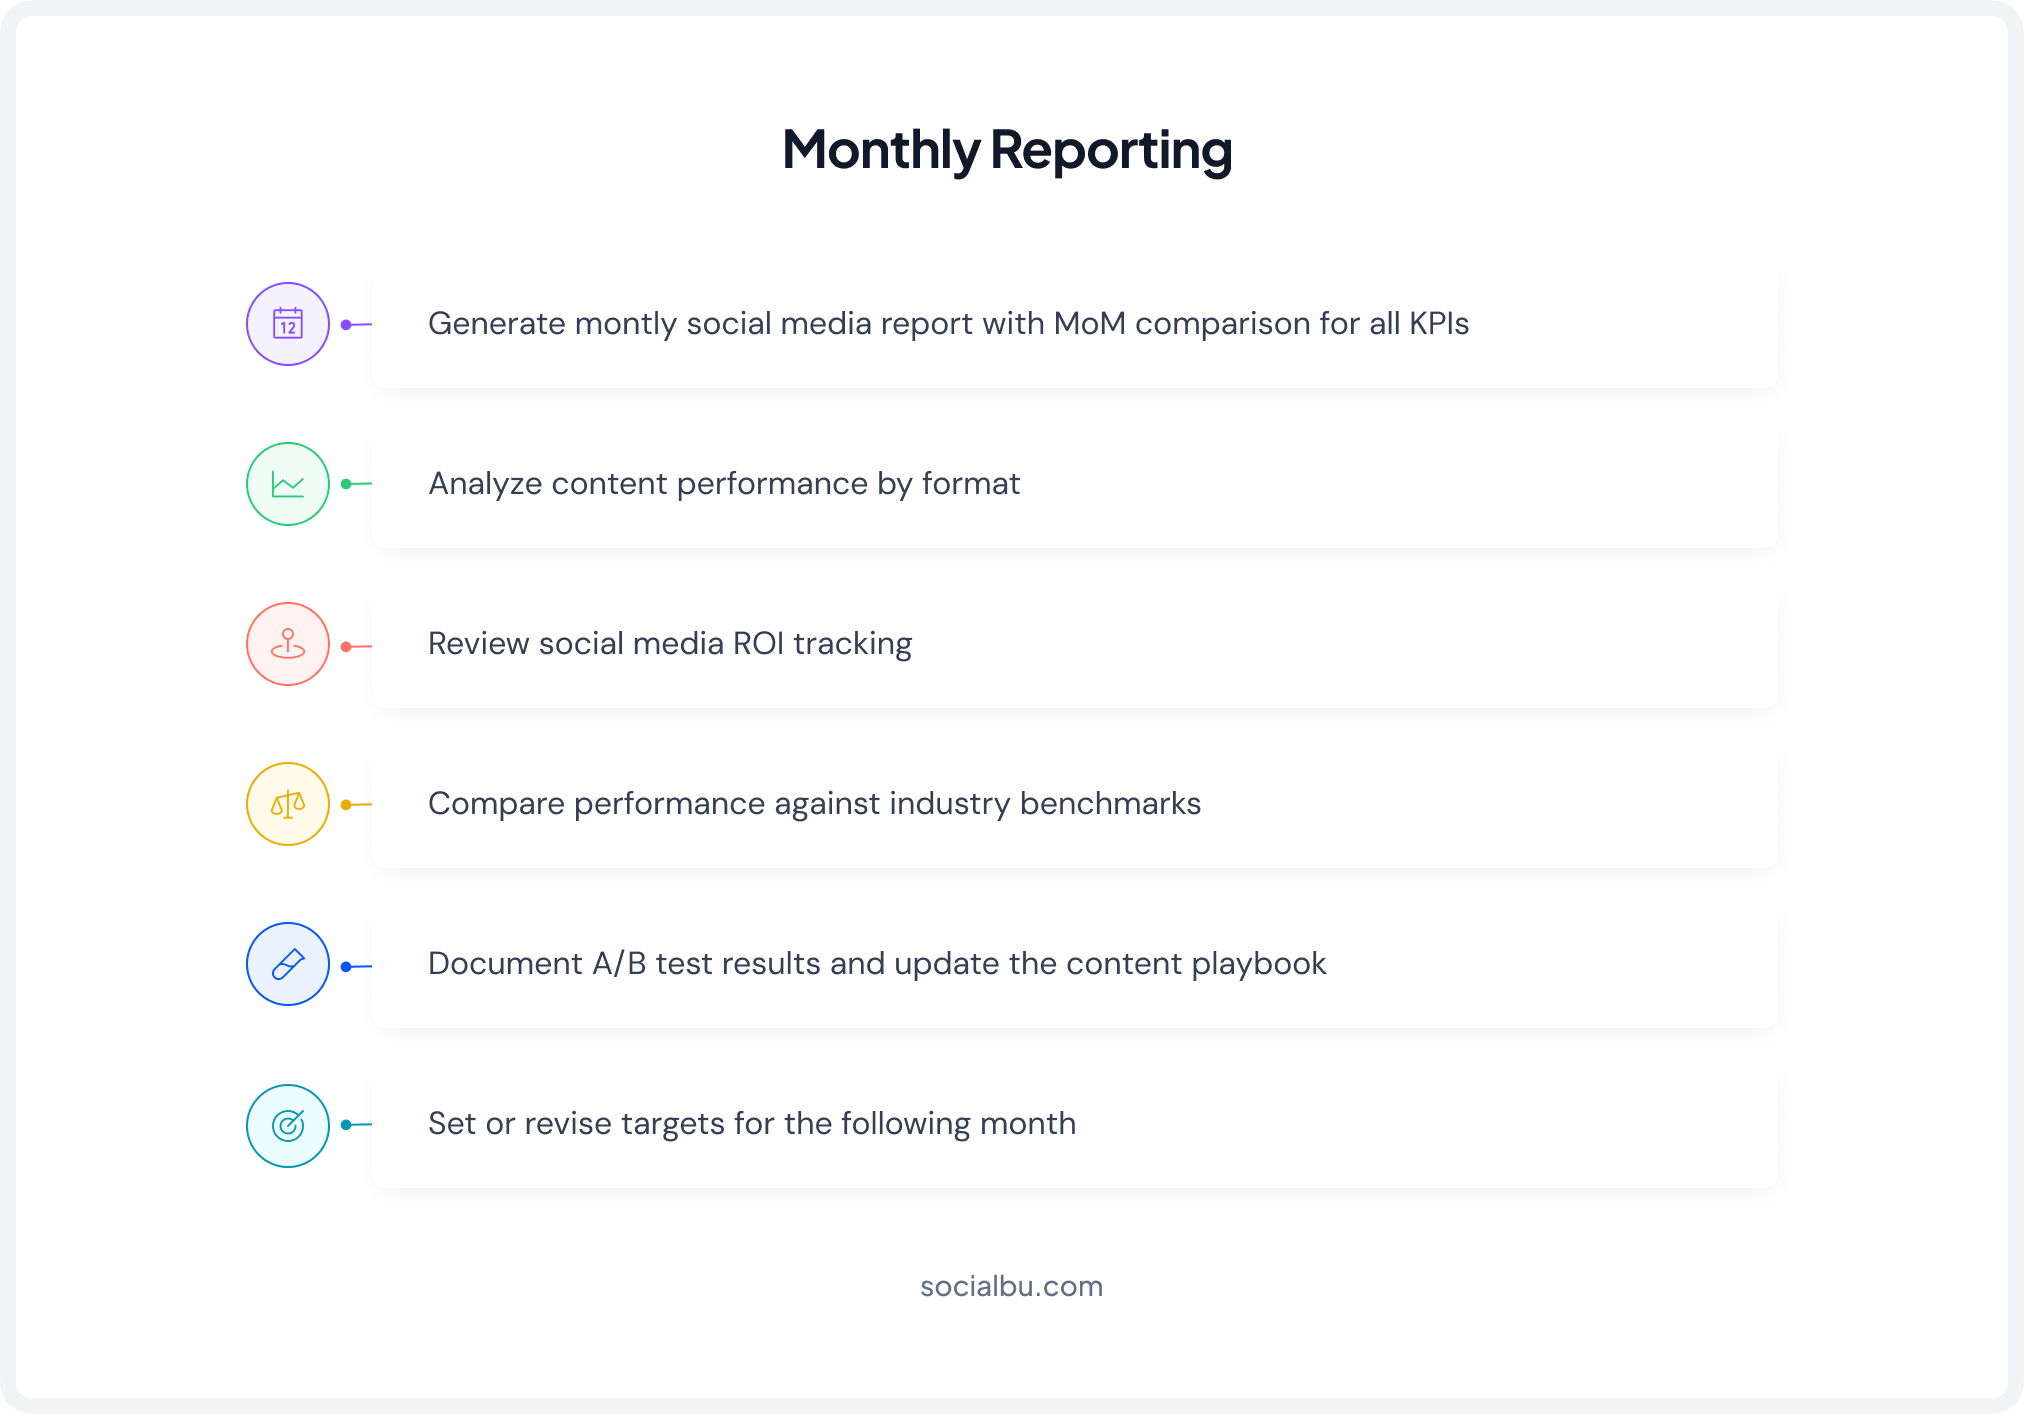
Monthly Reporting Framework
Monthly social media reports go deeper, i.e., track trend lines, test learnings, and strategic shifts. A comprehensive monthly report includes:
Key Metrics to Include in Every Report
Here are the key metrics to be included in every social media publishing report:
Metric | Weekly | Monthly |
Engagement Rate | ✓ | ✓ with MoM trend |
Reach/Impressions | ✓ | ✓ with MoM trend |
Follower Growth | ✓ | ✓ with analysis |
Click-through Rate | ✓ | ✓ |
UTM-Attributed Conversions | ✓ | ✓ with ROI calc |
Content Format Performance | Top 3 posts | Full breakdown |
Competitor Benchmarks | — | ✓ |
A/B Test Results | Flag if complete | Full analysis |
Common Reporting Mistakes to Avoid
Here are some common reporting mistakes that you should avoid while formulating your monthly and weekly reports:
- Reporting vanity metrics (raw likes) instead of goal-tied KPIs
- Not using a consistent social media reporting template
- Skipping the “so what”; every number needs context and a recommended action
- Reporting for all platforms equally; deprioritize platforms that don’t serve your goals
How Do You Improve Social Media Performance Using Benchmarks and Data?
Social media performance benchmarks give you context for your numbers. Without them, a 2% engagement rate could look bad, but it might actually be excellent for your industry and platform. Here are the current benchmarks based on the latest data.
2026 Industry Benchmarks
Platform | Avg. Engagement Rate | Avg. Reach Rate | Key Trend 2026 |
3% (By reach) | 3.50% | Views now primary metric; text overlays drive performance | |
0.15% | 1.65% | Engagement dipping gradually, video & groups outperform feed | |
TikTok | 5-5.5% | Interest-graph driven | Shares up 45%; trend-driven & recurring formats win |
X (Twitter) | 0.12% | Impression-based | Declining engagement trend continues; text-native posts hold |
5.2% | High for niche B2B | Newsletters & engagement posts outperform standard updates | |
Threads | 3.80% | Growing | Early adopter novelty fading; settling into a stable range |
Important Note on AI Content
Content identified by audiences as AI-generated sees a 12% engagement penalty on average across platforms in 2026. However, AI-augmented content, where AI assists in ideation or editing, but the final output feels human-created, shows no measurable negative impact. (Digital Applied)
Finding Your Best Performing Content
Sort your last 90 days of posts by engagement rate (not just raw engagement numbers, which favor accounts with larger followings). Look for patterns: What format appeared in the top 10? Topic? Day or time? What headline structure? These patterns are your content playbook.
Social Media A/B Testing
Systematic social media A/B testing is how you convert observations into repeatable results:
- Isolate one variable at a time: Test one element per experiment, headline vs. headline, image vs. video, morning post vs. evening post. Testing multiple variables at once makes it impossible to identify the cause.
- Use UTM parameters to differentiate variants: Give each variant a unique utm_content value so you can compare conversion data, not just engagement.
- Run tests long enough: A single post’s performance can be random. Run A/B tests across at least 3-5 post pairs before drawing conclusions.
- Document learnings in a running content playbook: Every test result is a data point. Keep a shared document so the whole team knows.
Finding the Best Time to Post
Generic “best time to post” guides are a starting point, not a final answer. Your actual best time to post depends on your specific audience’s behavior, not global averages. The right process:
- Check your platform native analytics for “when your followers are online” data
- Review your own post-performance data, sort by engagement rate, and look for time patterns
- Use SocialBu’s scheduling analytics to identify peak engagement windows for your account specifically
- Test different time slots systematically using A/B methodology, then lock in what the data confirms
Timeframe | Action | Goal |
Weekly | Review top/bottom posts, adjust next week’s schedule | Quick wins, fast feedback |
Monthly | Content format audit, benchmark comparison, A/B test analysis | Strategy refinement |
Quarterly | Full social media audit, platform ROI review, KPI reset | Strategic direction |
Social Media Audit & Performance Tracking Checklist
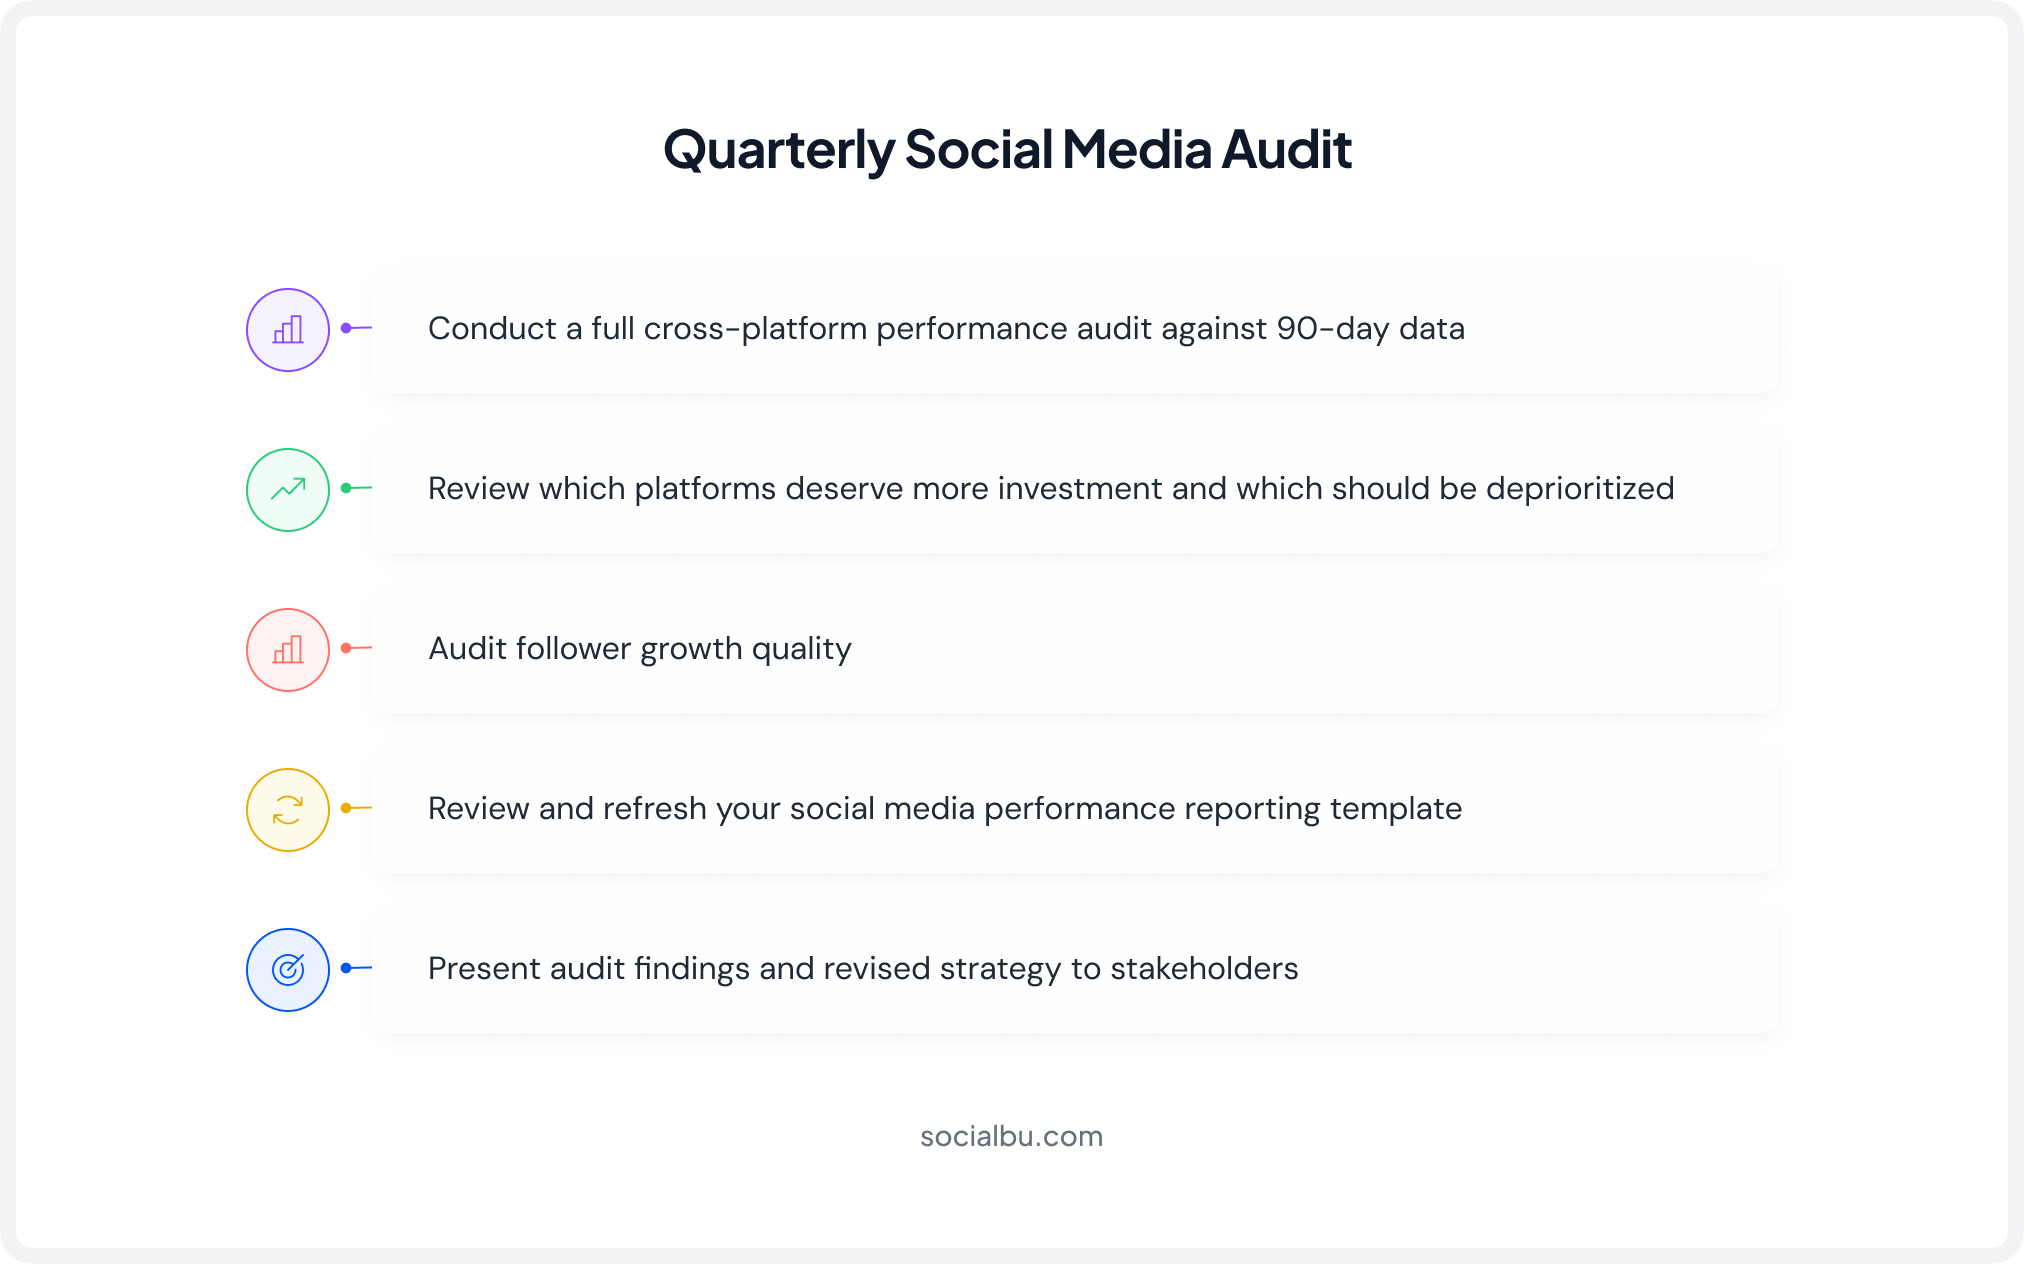
A social media audit is a structured review of your entire publishing history and current account health. It should be done quarterly, and the checklist below keeps your daily and weekly tracking in sync with those bigger-picture reviews.
Quarterly Audit Process
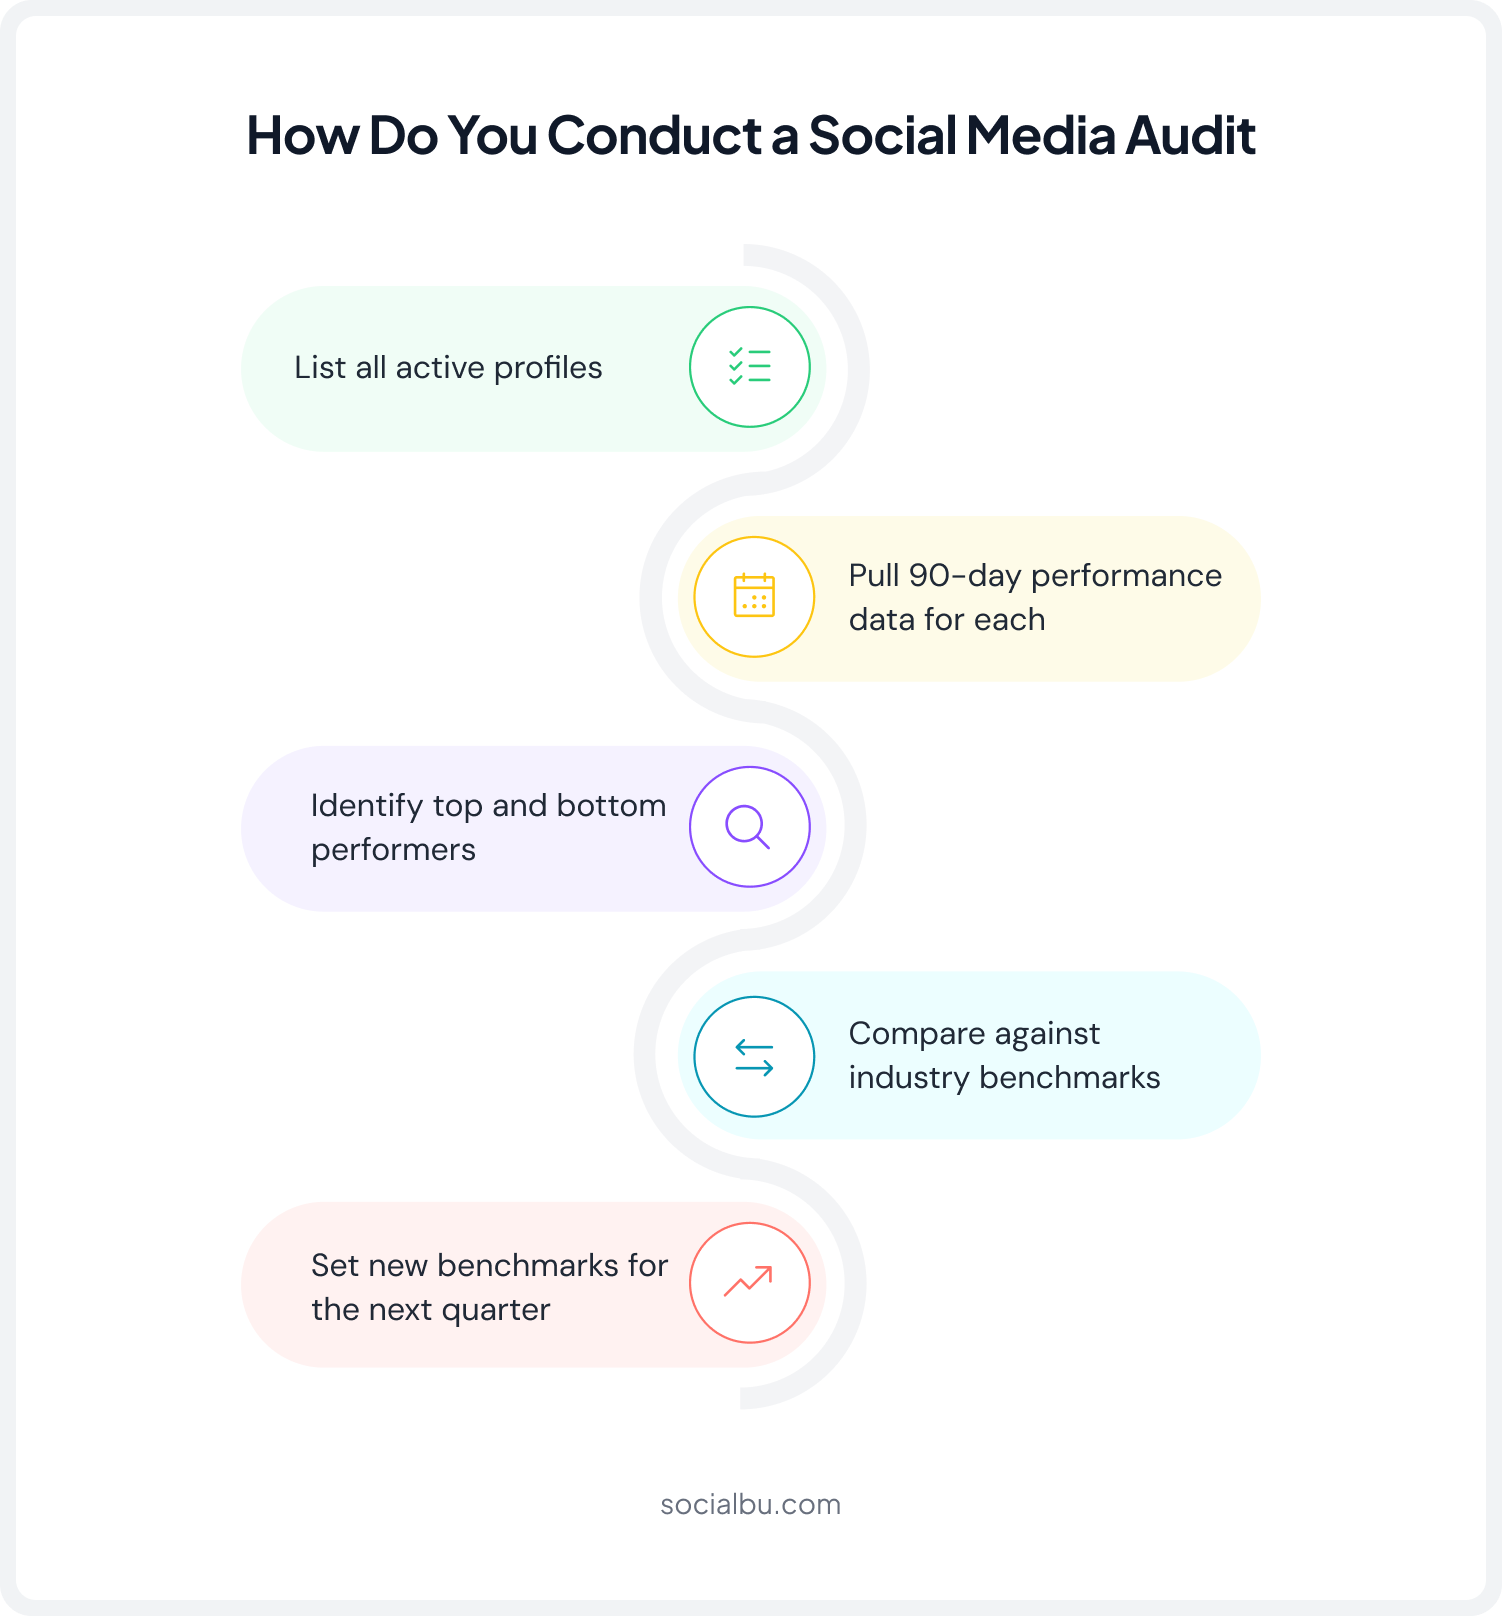
- List all active profiles: Include every platform where your brand has a presence. Note follower count, posting frequency, and last active data.
- Pull 90-day performance data: Export reach, engagement, follower growth, and top posts from each platform or your analytics tool.
- Identify top and bottom performers: Your top posts reveal what to double down on; your bottom posts reveal what to stop doing.
- Compare against industry benchmarks: Use the 2026 benchmarks above to contextualize your numbers.
- Set new benchmarks for the next quarter: Aim for a 10-20% improvement in your primary KPI over 90 days.
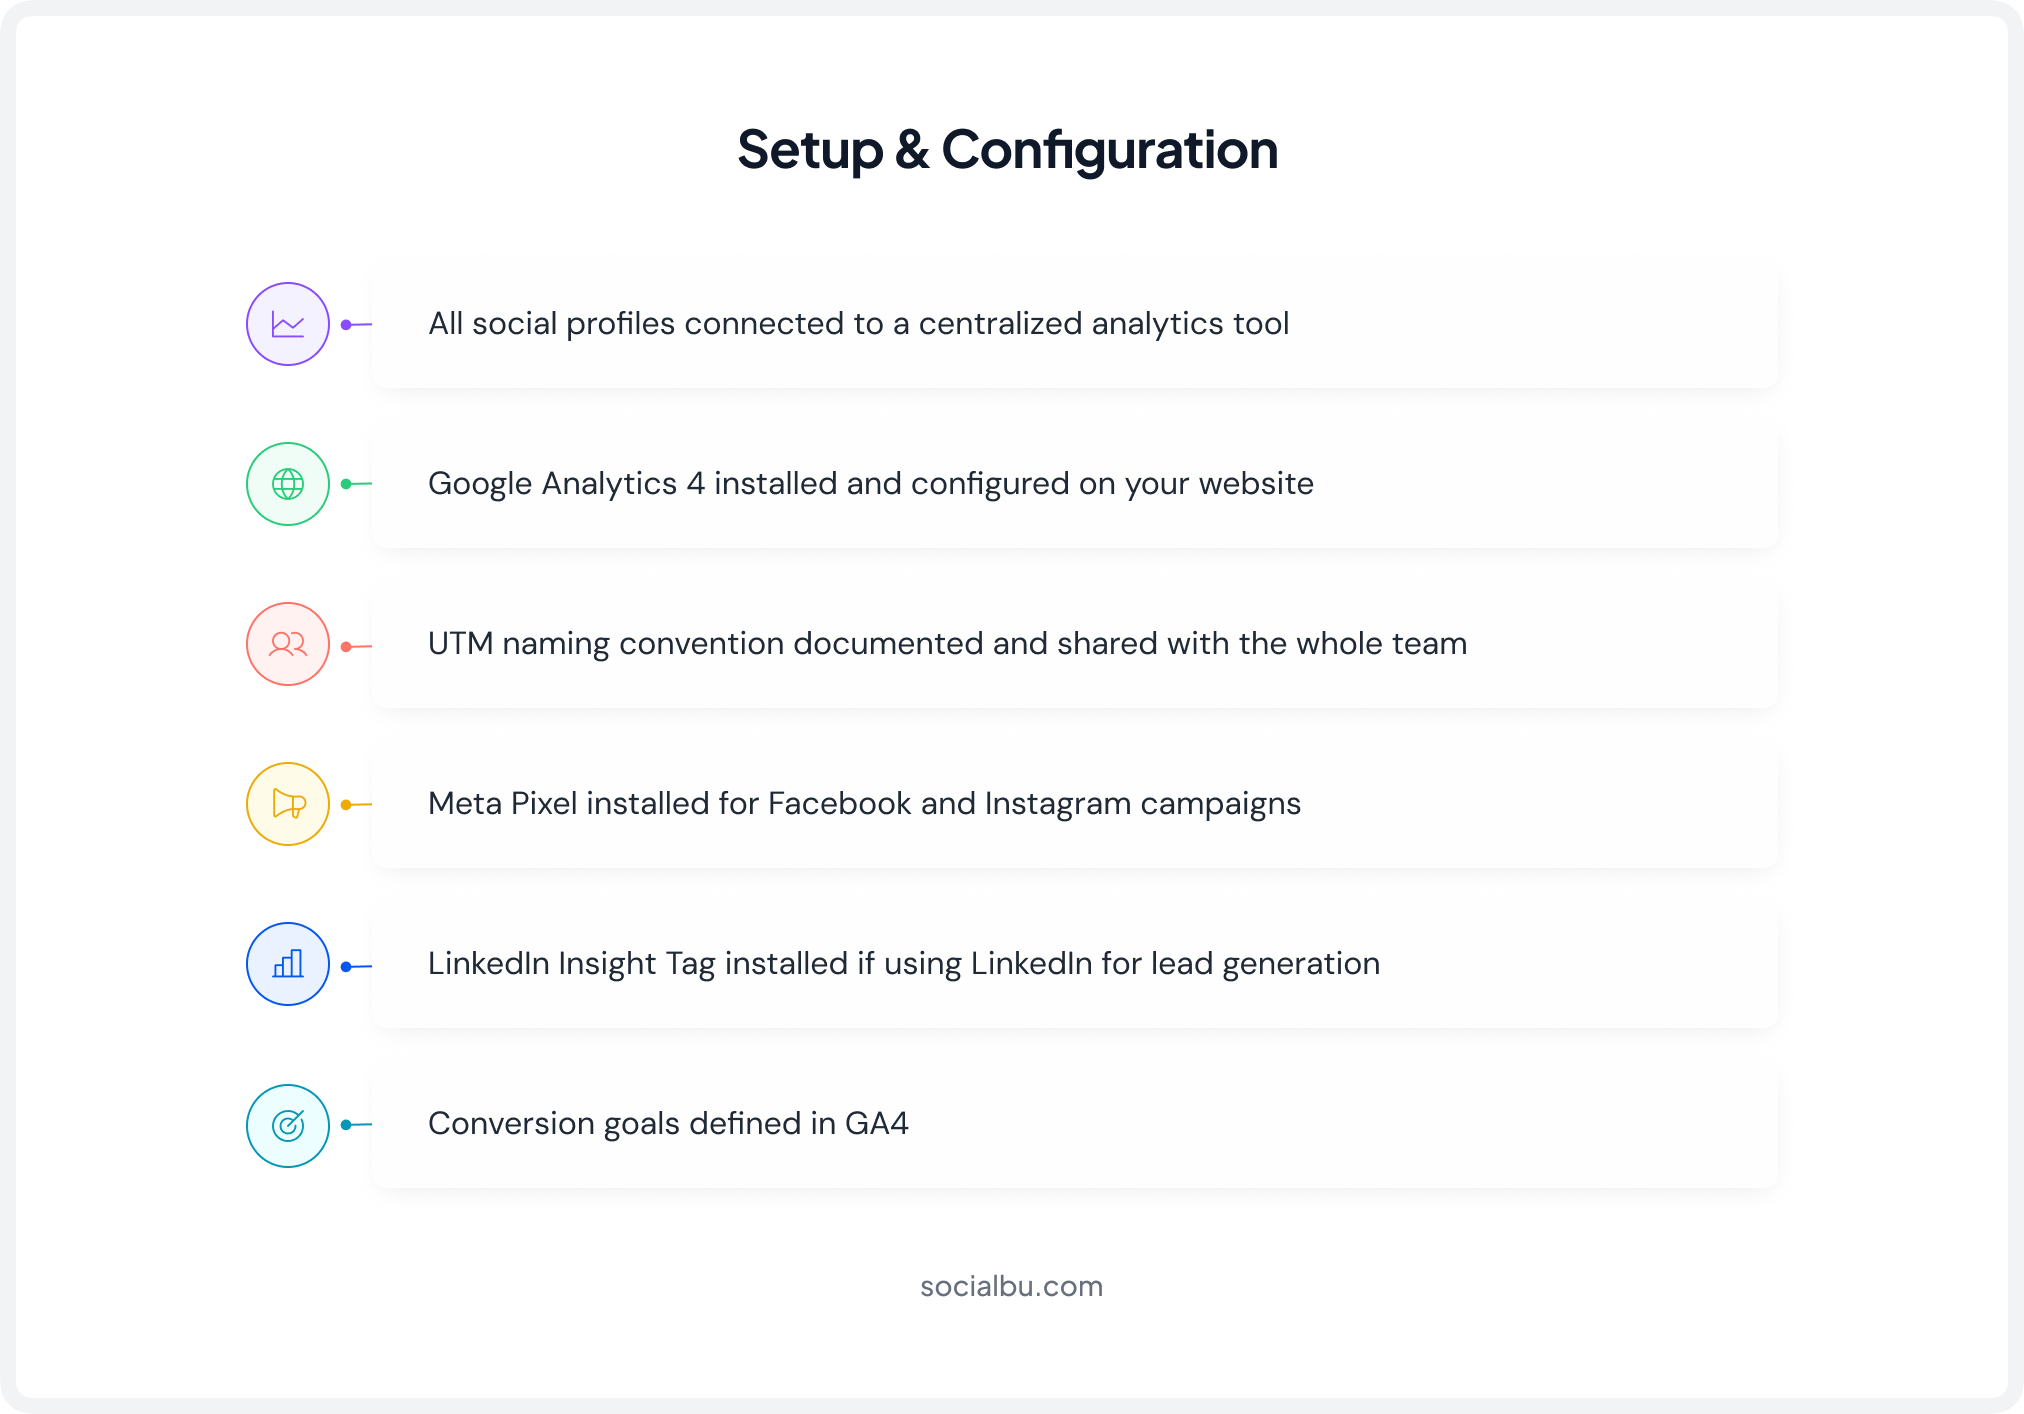
Setup & Configuration Checklist
Weekly Review Checklist
![]()
Monthly Review Checklist
Quarterly Review Checklist
Final Words
Learning how to track social media publishing performance isn’t about obsessing over every metric; it’s about measuring the right things, consistently, and acting on what you find. Define your goals. Pick KPIs that connect to those goals. Set up UTM tracking so social activity maps to real business outcomes. Review weekly, report monthly, and audit quarterly.
The brands growing fastest on social media in 2026 aren’t the ones posting the most; they’re the ones learning the fastest. And the fastest way to learn is with the right tools.
SocialBu brings your entire publishing and analytics workflow into one place: scheduling, cross-platform performance tracking, automated reporting, and AI-powered insights, so your team spends less time in dashboards and more time making content that actually converts.
Start your free trial today and see the difference data-driven publishing makes.
FAQs
Q: How to track the performance of social media posts?
Track metrics such as reach, impressions, engagement, clicks, shares, and conversions using social media analytics tools. Compare results against your goals to identify what content performs best.
Q: What is the 70/20/10 rule in social media?
The 70/20/10 rule suggests that 70% of content should educate or entertain, 20% should curate or share content from others, and 10% should directly promote your products or services.
Q: What are the 4 types of social media analytics?
The four main types are descriptive analytics (what happened), diagnostic analytics (why it happened), predictive analytics (what may happen next), and prescriptive analytics (what actions to take).
Q: What are the key performance indicators in social media?
Social media KPIs are measurable metrics used to evaluate success, including engagement rate, reach, impressions, follower growth, click-through rate, and conversions.
Q: How to measure the success of social media posts?
Measure success by tracking performance metrics that align with your objectives, such as engagement, traffic, lead generation, conversions, or brand awareness.
Q: What are the four pillars of social media content?
The four pillars of social media content are educational, entertaining, inspirational, and promotional content. A balanced mix helps attract, engage, and convert your audience.
Your Next Step
If you’re still manually tracking social media performance across separate platform tabs, you’re losing hours every week. SocialBu gives you everything in one place: unified analytics, automated reports, and publishing that’s backed by real data.
Try SocialBu Free ➡️