Winning on Instagram in 2026 feels different. Last year’s approach is already outdated; the algorithm now favors new formats, and your audience’s attention is divided.
So, how do you keep up? You stop guessing and start using data.
We’ve gathered the 29 essential Instagram statistics you need to build a smarter Instagram strategy for 2026. This guide gives you the blueprint. SocialBu provides the tools to implement it, helping you schedule, analyze, and grow on the platform without the manual work.
Here’s the data you need.
Instagram Statistics: The State of the Platform
Instagram remains one of the most influential social platforms for users, creators, and businesses. Let’s look at the general Instagram statistics that set the tone for 2026.
1. Instagram is the 3rd Most-Used Social Media Platform
With your audience here, make Instagram your go-to channel for global reach.
Behind only Facebook and YouTube, Instagram’s massive user base makes it the third most popular social media platform, making it an essential tool for reaching diverse and engaged audiences worldwide.
2. 99.8% of Instagram Users are Active on Other Platforms
Your audience isn’t siloed; repurpose your content to meet them wherever they are.
Data shows that only 0.2% of Instagram users are exclusive to the platform. They are multi-platform consumers. Here’s where else they hang out:
- 80.3% also use Facebook
- 76.9% also use YouTube
- 54.3% also use TikTok
3. Celebrity and Pop Culture Dominate the Most-Followed Accounts
The platform is purely for entertainment, sports, and creator culture.
In a fun twist, the most-followed account is Instagram’s official page (@instagram), followed by global icons like Cristiano Ronaldo and Leo Messi. This highlights how personality-driven content continues to shape engagement trends.
| Account | Handle | Followers |
|---|---|---|
| 698+M | ||
| Cristiano Ronaldo | @cristiano | 670+M |
| Leo Messi | @leomessi | 511+M |
| Selena Gomez | @selenagomez | 416+M |
| Kylie Jenner | @kyliejenner | 394.41M |
| Dwayne Johnson | @therock | 391+M |
| Ariana Grande | @arianagrande | 372+M |
| Kim Kardashian | @kimkardashian | 354+M |
| Beyoncé | @beyonce | 308+M |
| Khloé Kardashian | @khloekardashian | 300+M |
4. 84% of Social Media Users Have an Instagram Profile
84% of social media users worldwide have an Instagram account.
This near-universal adoption among internet users proves its immense reach and cultural relevance.
5. Users Spend Nearly 33 Minutes a Day on the App
This means you have a consistent, daily window of opportunity to capture attention.
Globally, users spend an average of 32.4 minutes per day scrolling, totaling over 16 hours per month. In the U.S., that number is even higher at 33.1 minutes per day (eMarketer). This daily habit is a prime opportunity for brands to connect through compelling content.
6. Video is the Most Consumed Content Format
If you’re not prioritizing video, you’re already falling behind.
Reels now account for over 50% of the time people spend on Instagram. Users are actively engaging with short-form video more than any other format.
Prioritize creating Instagram Reels that leverage trending audio and storytelling to increase your chances of appearing on the main feed, Explore page, and dedicated Reels tab.
7. The Average Engagement Rate on Instagram is 0.43%
Not all content formats are created equal; Reels and Carousels are your key to beating the average.
According to a benchmark report, organic reach is more competitive than ever. However, the data reveals a clear hierarchy of engagement:
- Reels: 1.23% (The king of engagement)
- Carousels: 0.99%
- Image Posts: 0.70%
Develop a diversified content calendar that prioritizes Reels for reach and Carousels for in-depth storytelling and education.
What This Means for You:
Instagram is the leading platform for growth. Your audience is active daily, watching Reels and engaging with multiple forms of content, and they see your content alongside that of other platforms.
Automate Your Instagram Growth
Try SocialBu for under $20/month — no hidden fees, no sales calls.
Instagram User and Audience Demographics
Understanding who is on Instagram is just as important as knowing the number of users. Let’s break down the demographics.
8. Instagram Has Over 3 Billion Monthly Active Users (MAUs)
With 3 billion MAUs, the platform provides a massive reach for brands seeking to connect with consumers.
This massive user base means your target customers are almost on the platform, making it one of the best places to grow your audience.
9. Instagram Has Nearly 5,00 Million Daily Active Users (DAUs)
Instagram has nearly 500 million daily active users.
That’s one-fourth of MAUs logging in daily, providing consistent opportunities for marketers to engage with their audiences.
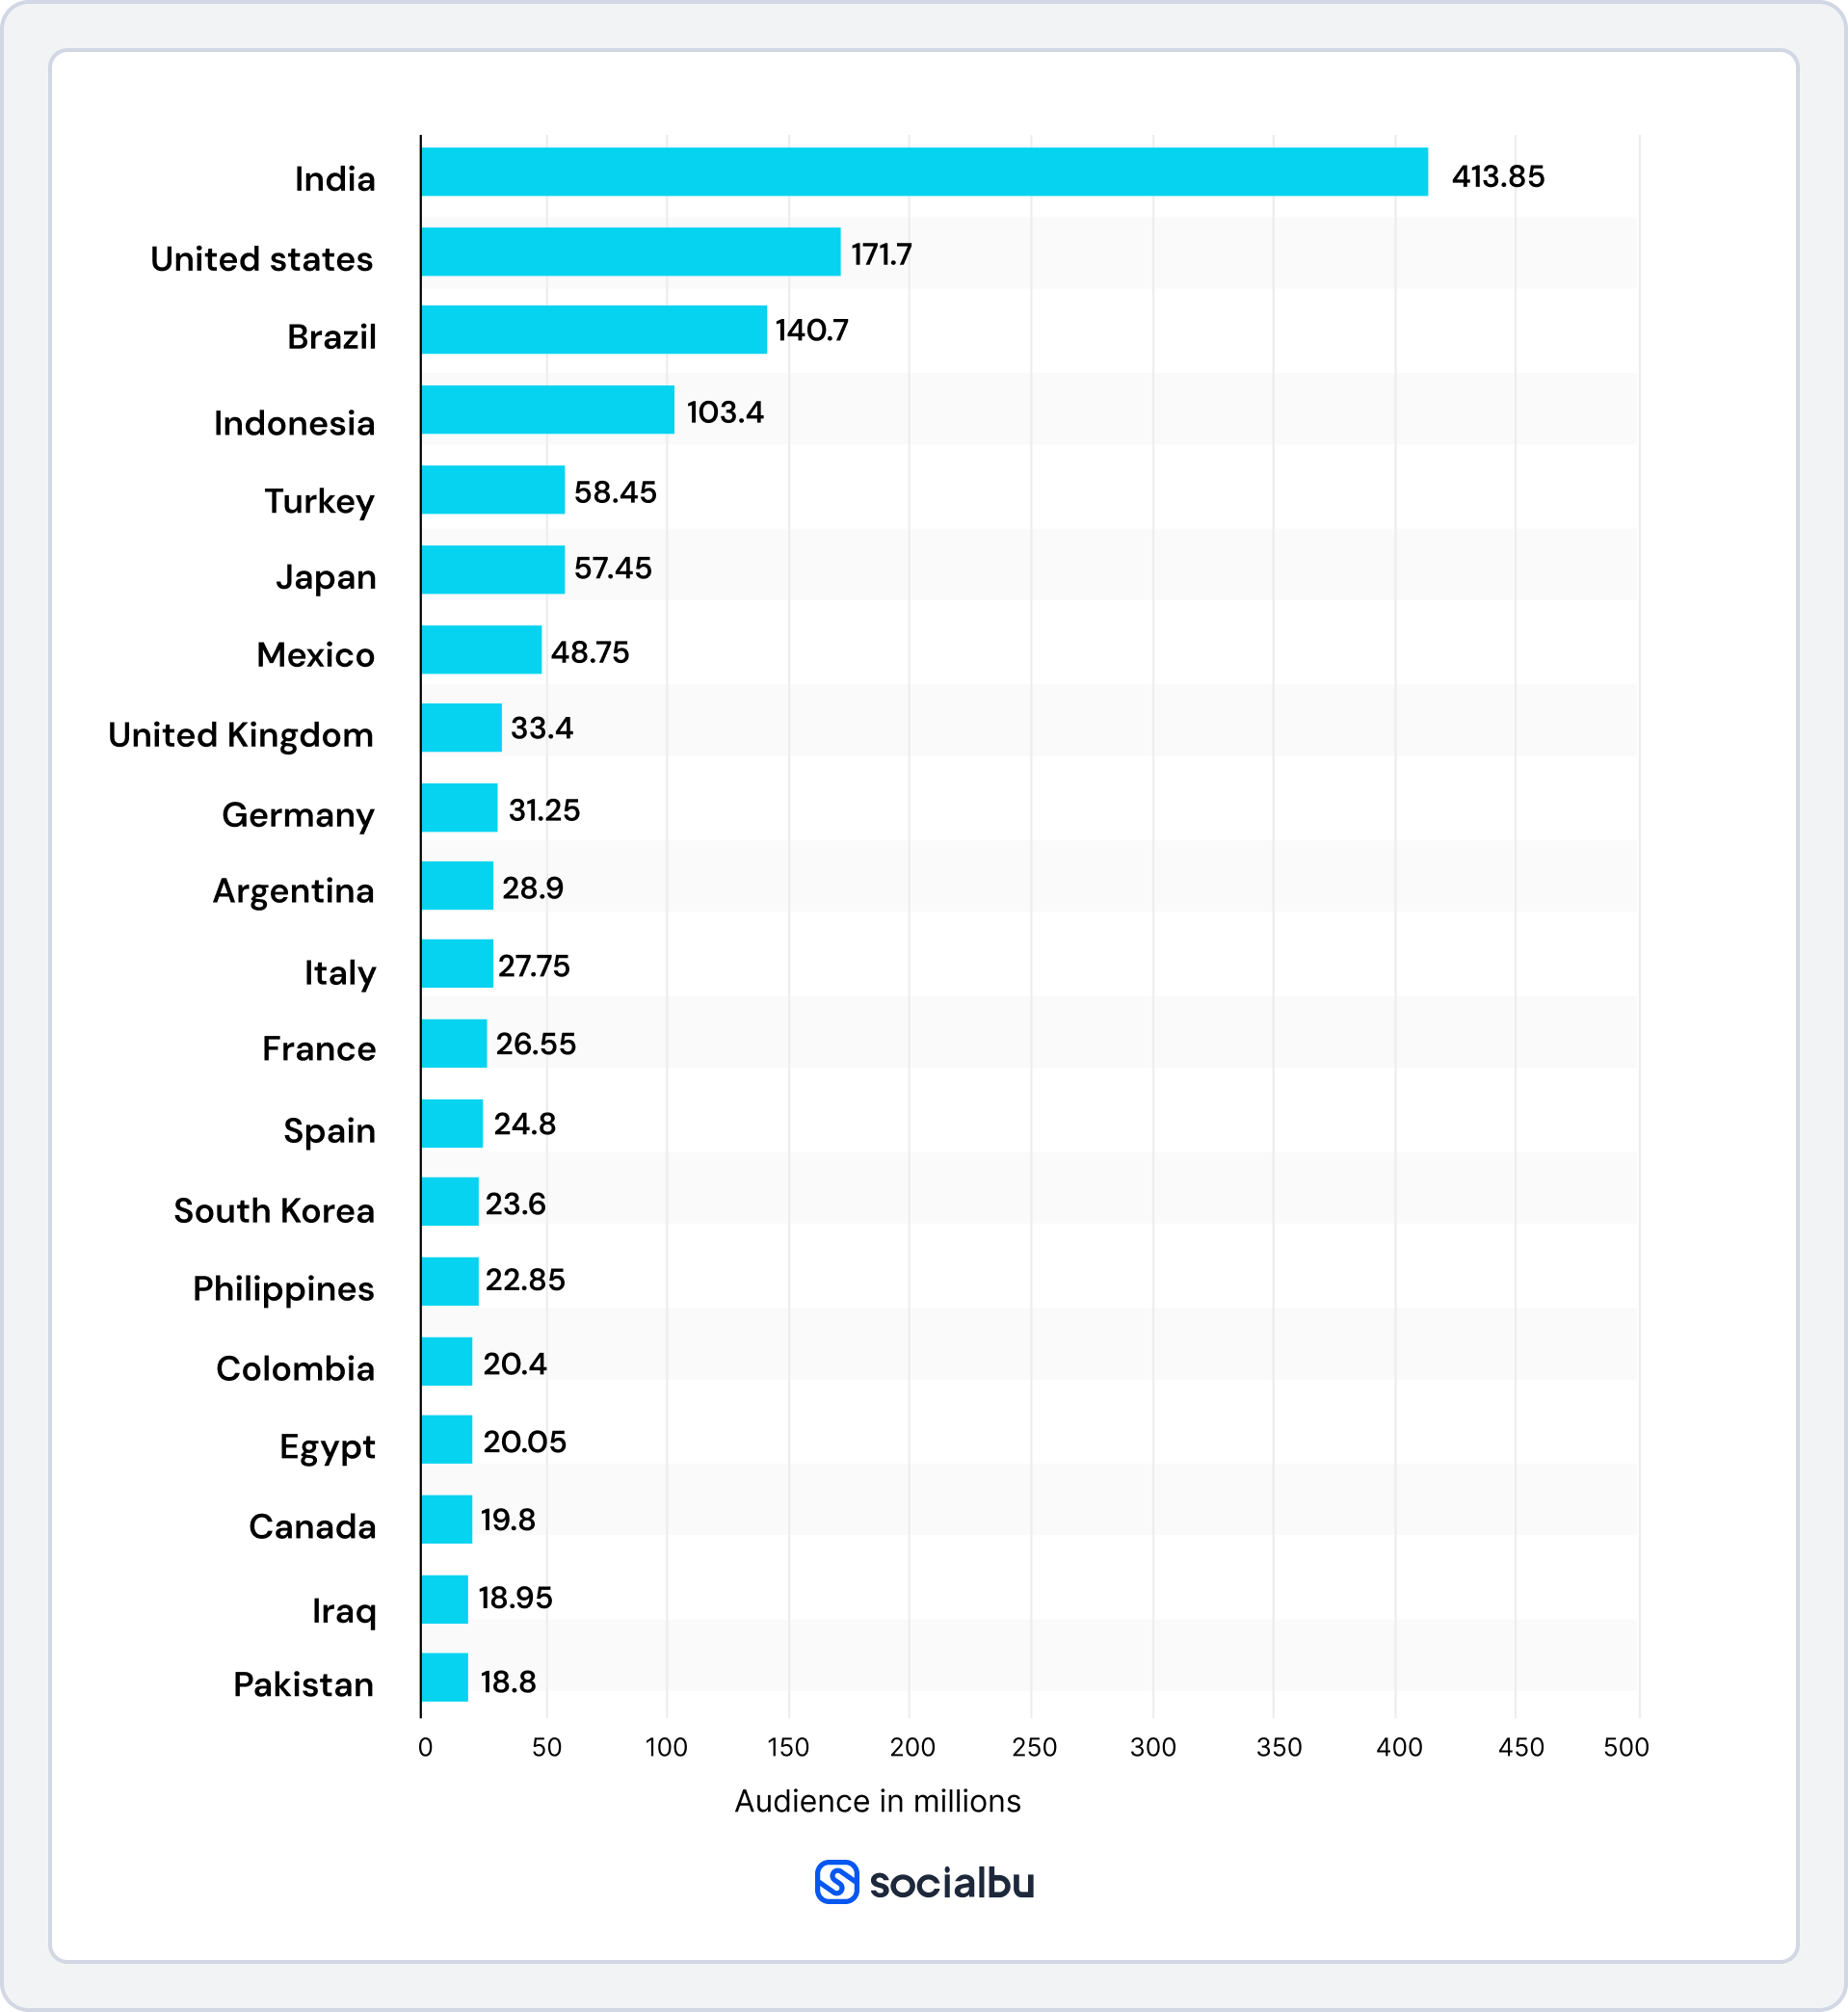
10. India and the U.S. Lead the World in User Count
For global brands, these two countries are priority markets with massive audiences. However, Brazil and Indonesia show rapid adoption growth worth tapping into.
The top countries by Instagram users are:
- India: 413.85 million
- United States: 171.7 million
- Brazil: 140.7 million
- Indonesia: 103.4 million
- Turkey: 58.45 million
- Japan: 57.45 million
11. Southern Asia is the Region with the Most Users
Global content strategies should consider regional and language preferences to maximize resonance and relevance.
Here is the breakdown of users region-wise:
- Southern Asia: 448 million
- Southern America: 237 million
- North America: 192 million
- South-Eastern Asia: 177 million
- Western Asia: 133 million
- Eastern Asia: 101 million
- Western Europe: 78 million
- Africa (all regions): 91 million
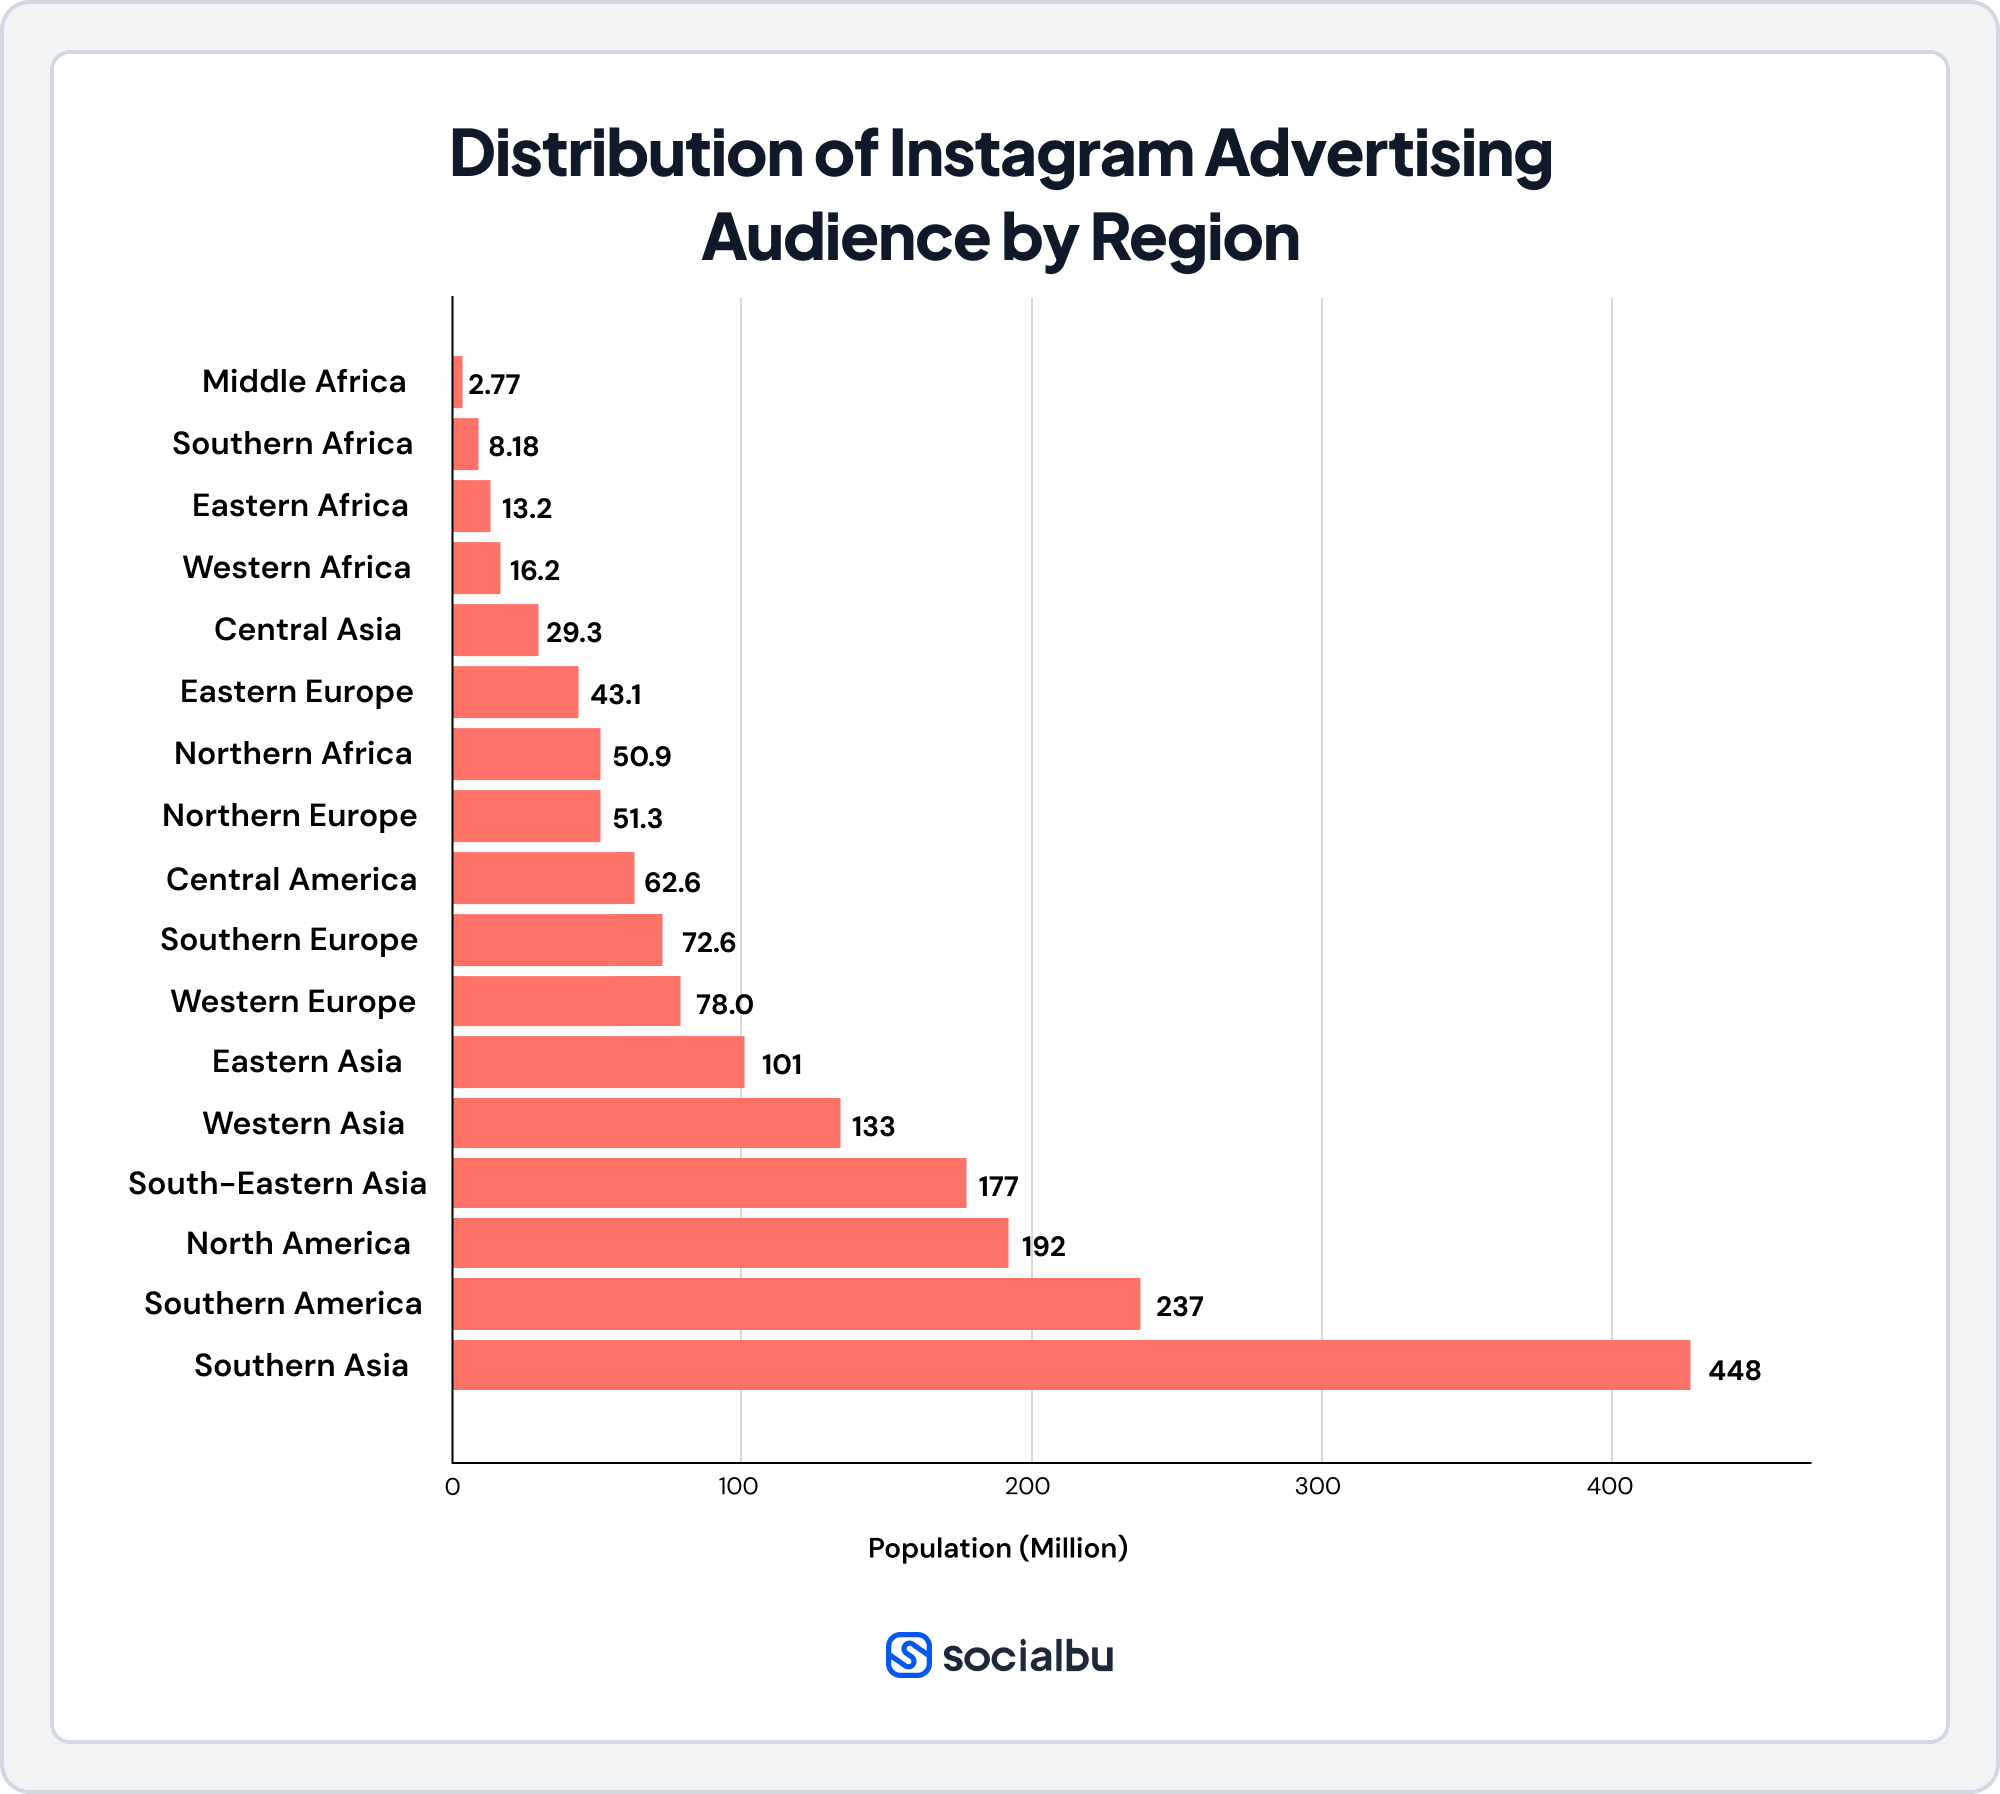
If you’re targeting growth in South America, consider creating content in Spanish or Portuguese to resonate with local users.
12. Age Group Distribution of Instagram Users
The age breakdown of Instagram’s global audience confirms its youthful skew. Over half of all users are 34 or younger.
Age Group Percentage of Instagram Global Users
- 18–24: 29.5%
- 25–34: 31.6%
- 35–44: 16.3%
- 45–54: 9%
- 55–64: 4.9%
- 65+: 3.2%
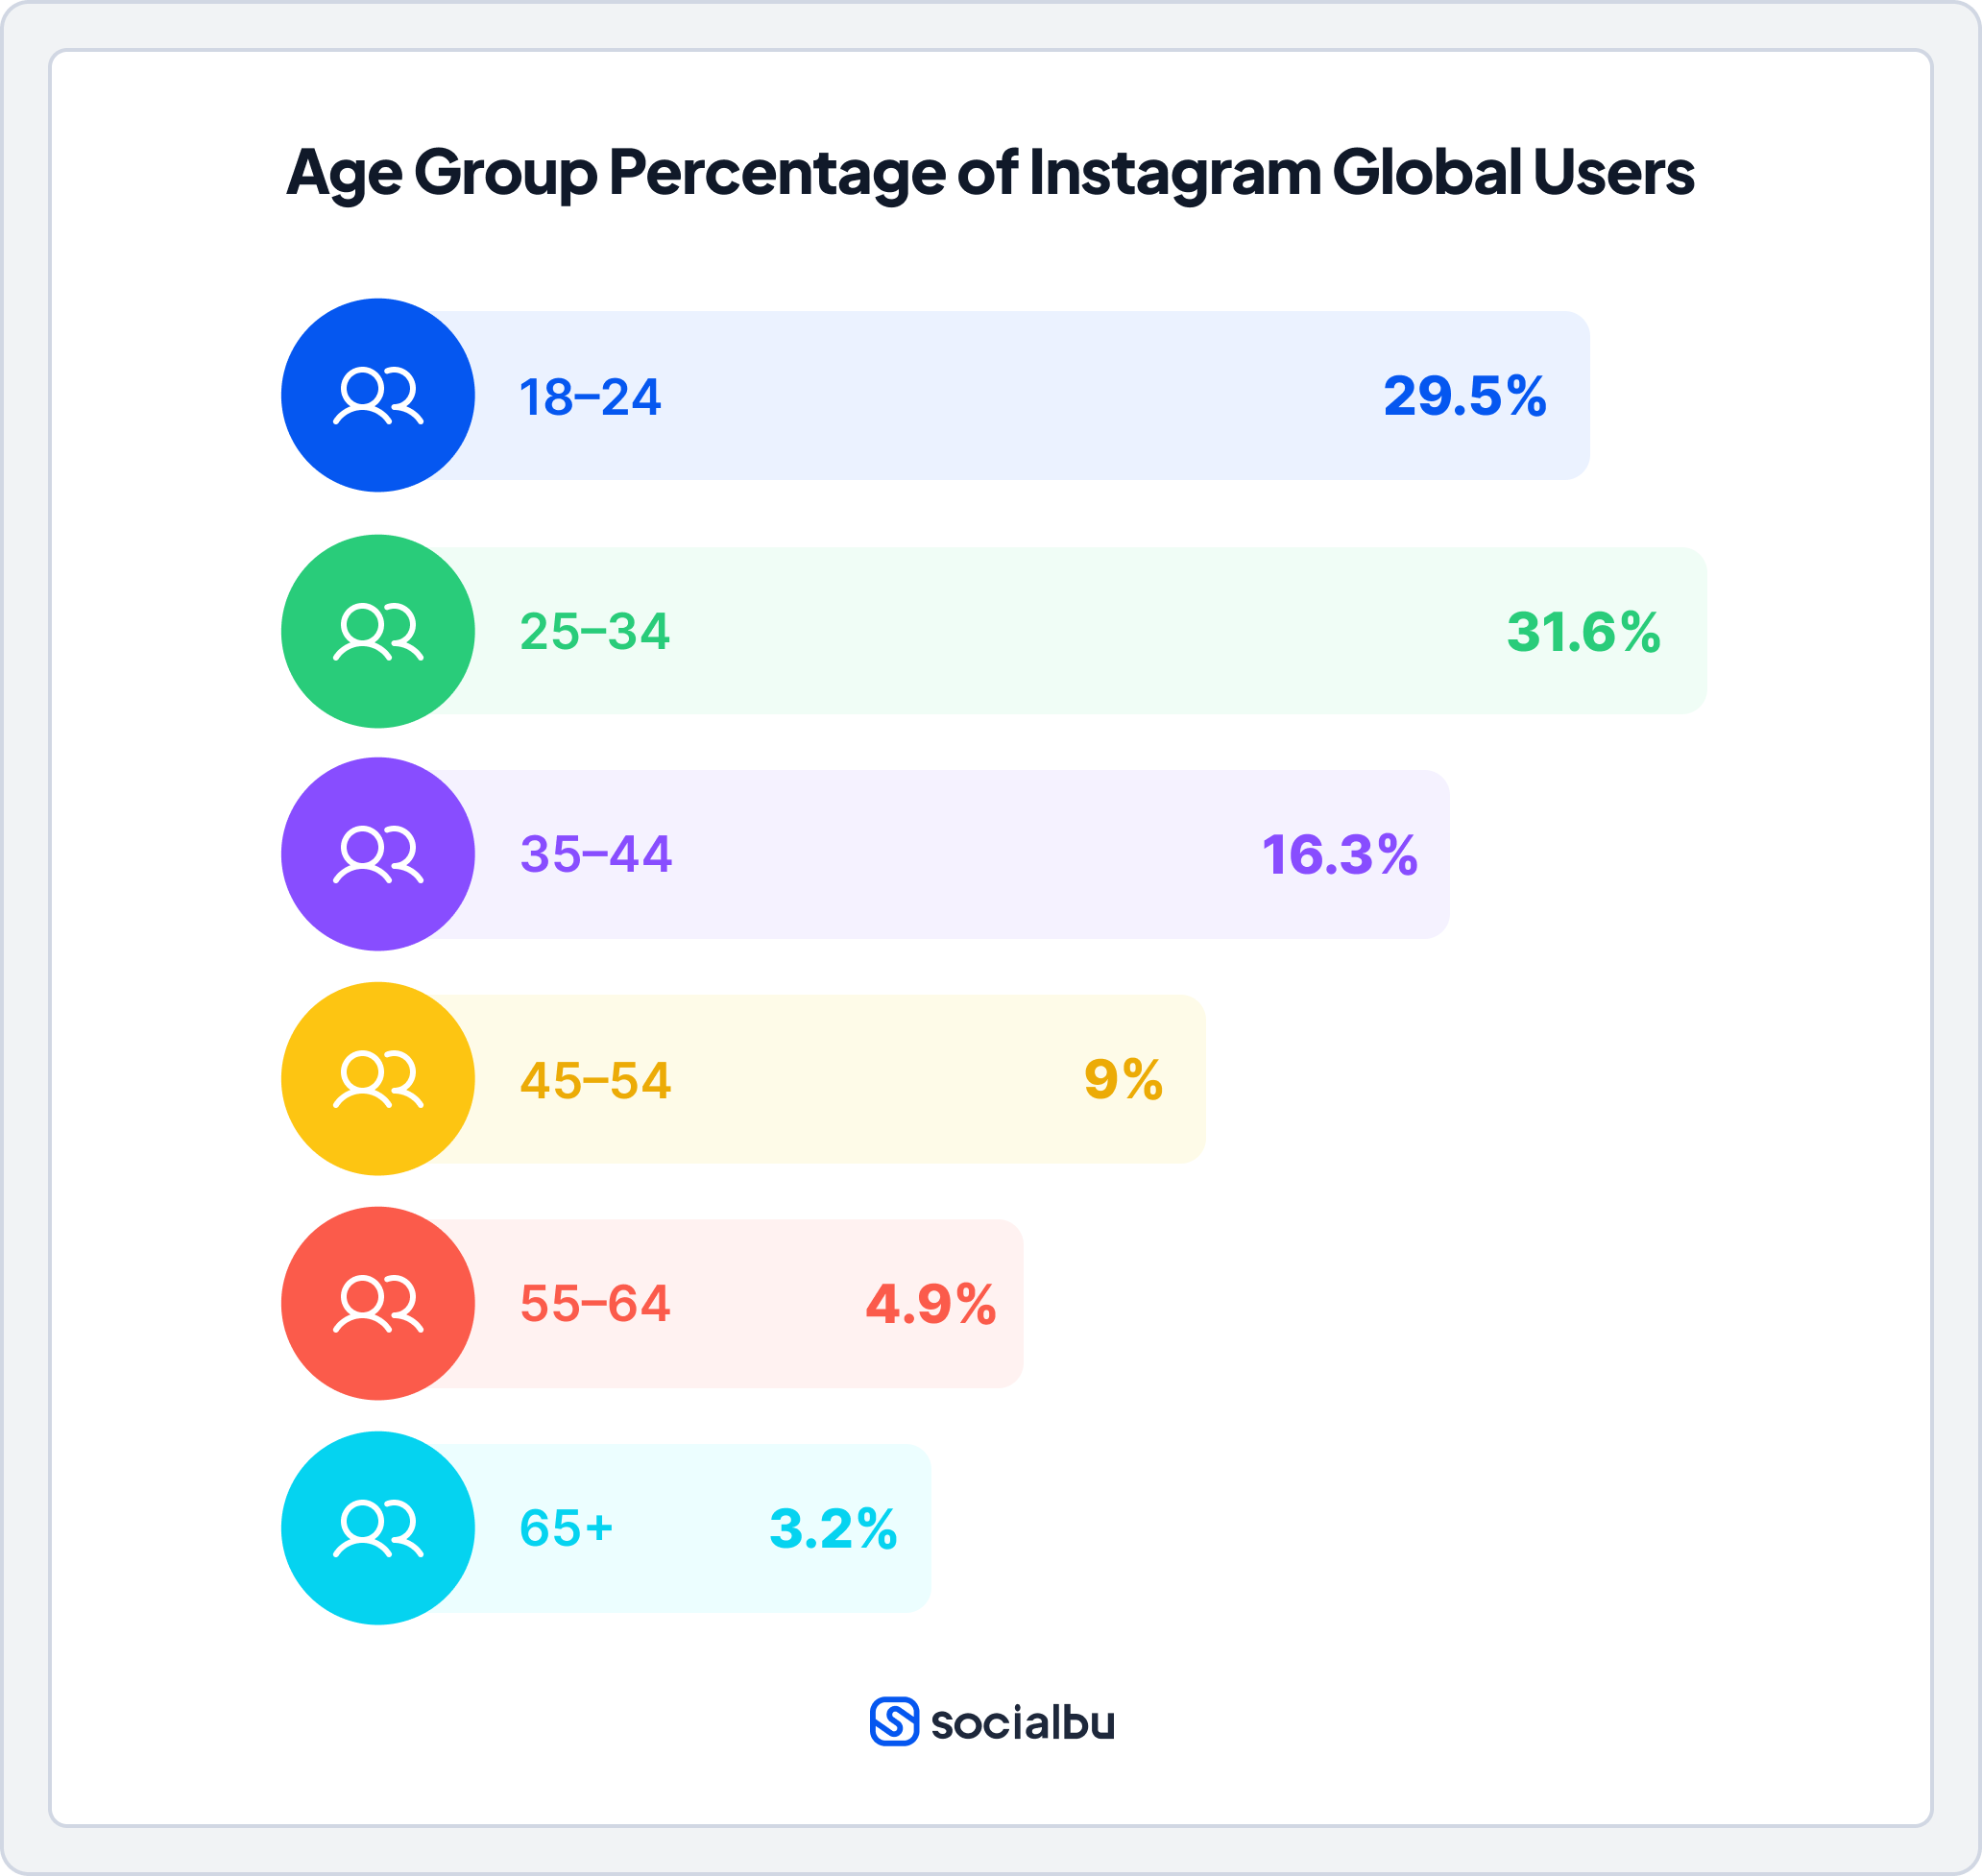
This data shows that, while the platform is popular among young adults, it also attracts millions of users from older demographics. This presents significant opportunities for brands targeting Gen X and Boomers.
13. The Gender Split on Instagram is Nearly 50/50
The platform is an effective channel for brands targeting any gender.
Global data shows a remarkably balanced distribution:
- Male: 52.5%
- Female: 47.5%
What This Means for You:
These Instagram statistics indicate that your target customer is likely to be on Instagram, particularly if you’re targeting individuals under 35. The audience is global and evenly split between genders, making it a versatile platform for almost any brand.
Instagram Marketing & Advertising Statistics
For marketers, Instagram is a revenue-driving platform. Here’s what the data says.
14. In-Feed Ads Still Generate the Most Revenue
While Reels receive the organic glory, classic Feed ads are the platform’s primary revenue generator.
Instagram Feed ads account for 53.7% of total ad revenue, while Stories contribute 24.6%. As Reels monetization evolves, expect this to shift, but for now, the Feed remains a top ad placement.
15. Instagram Ad Costs are Flexible and Affordable
The platform offers highly targeted advertising that is accessible to most budgets. However, it’s also heavily influenced by your industry, audience, and campaign objective.
A survey provides a helpful benchmark for average costs:
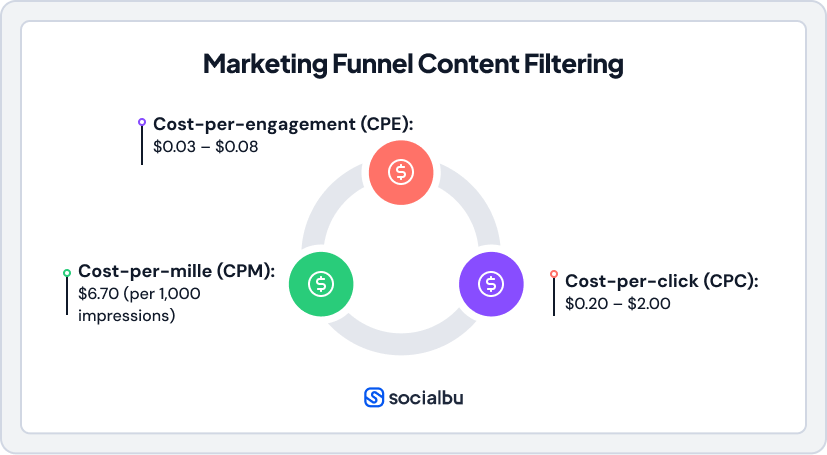
This makes Instagram ads more affordable than traditional ads while still offering highly targeted options.
16. The Average Ad Conversion Rate is 1-2%
Well-optimized campaigns can reliably drive growth and exceed industry benchmarks.
The average conversion rate for Instagram ads ranges between 1% and 2%. However, highly targeted campaigns often exceed 3%, especially for objectives like catalog sales and lead generation.
What This Means for You:
Running ads on Instagram is an affordable and effective way to reach your specific customers. Even with a small budget, you can run targeted campaigns in the Feed to drive traffic and sales.
Instagram Statistics: Content & Engagement
Content trends on Instagram are constantly evolving. This is what the data currently shows.
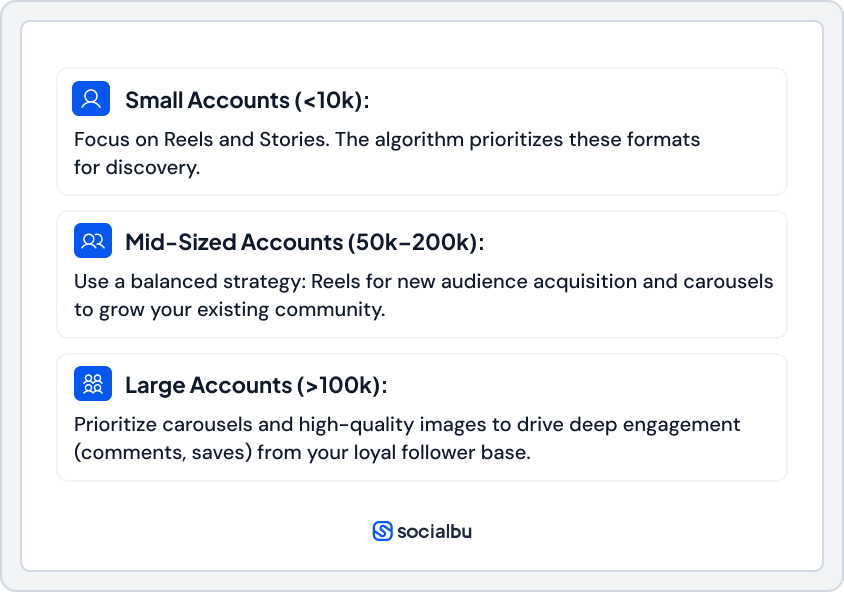
17. Optimal Content Strategy Varies by Follower Count
There is no one-size-fits-all strategy; tailor your content strategy to your account size and needs.
A study reveals key differences mentioned below:
18. Reels Generate 125% More Reach Than Image Posts
Instagram Reels are the single most powerful tool for discoverability and reaching new audiences.
According to statistics, Reels brings in nearly 36% more reach than carousels and a staggering 125% more than single-image posts.
The data shows a massive advantage for smaller accounts:
- Accounts with 1k-5k followers: See the highest Reels view rate at an incredible 20%.
- Accounts with 5k-10k followers: Have the next-best view rate at 10.20%.
Don’t miss the chance to captivate your audience. Even a few well-crafted Reels can significantly boost your visibility.
Explore our guide on crafting an effective Instagram Reels strategy.
19. Stories are a Sweet Spot for Smaller Brands
For brands with under 10k followers, Stories are a secret spot for connection and visibility.
A study reported a 35% increase in Story reach for brands in this segment, making it a must-use format for building deeper community connections.
20. Carousels Drive the Highest Quality Engagement
While Reels are for reach, Carousels are for connection and community building.
Data shows carousels drive 114% more engagement (likes, comments, saves) than single images. They are perfect for educational content, tutorials, and multi-part storytelling.
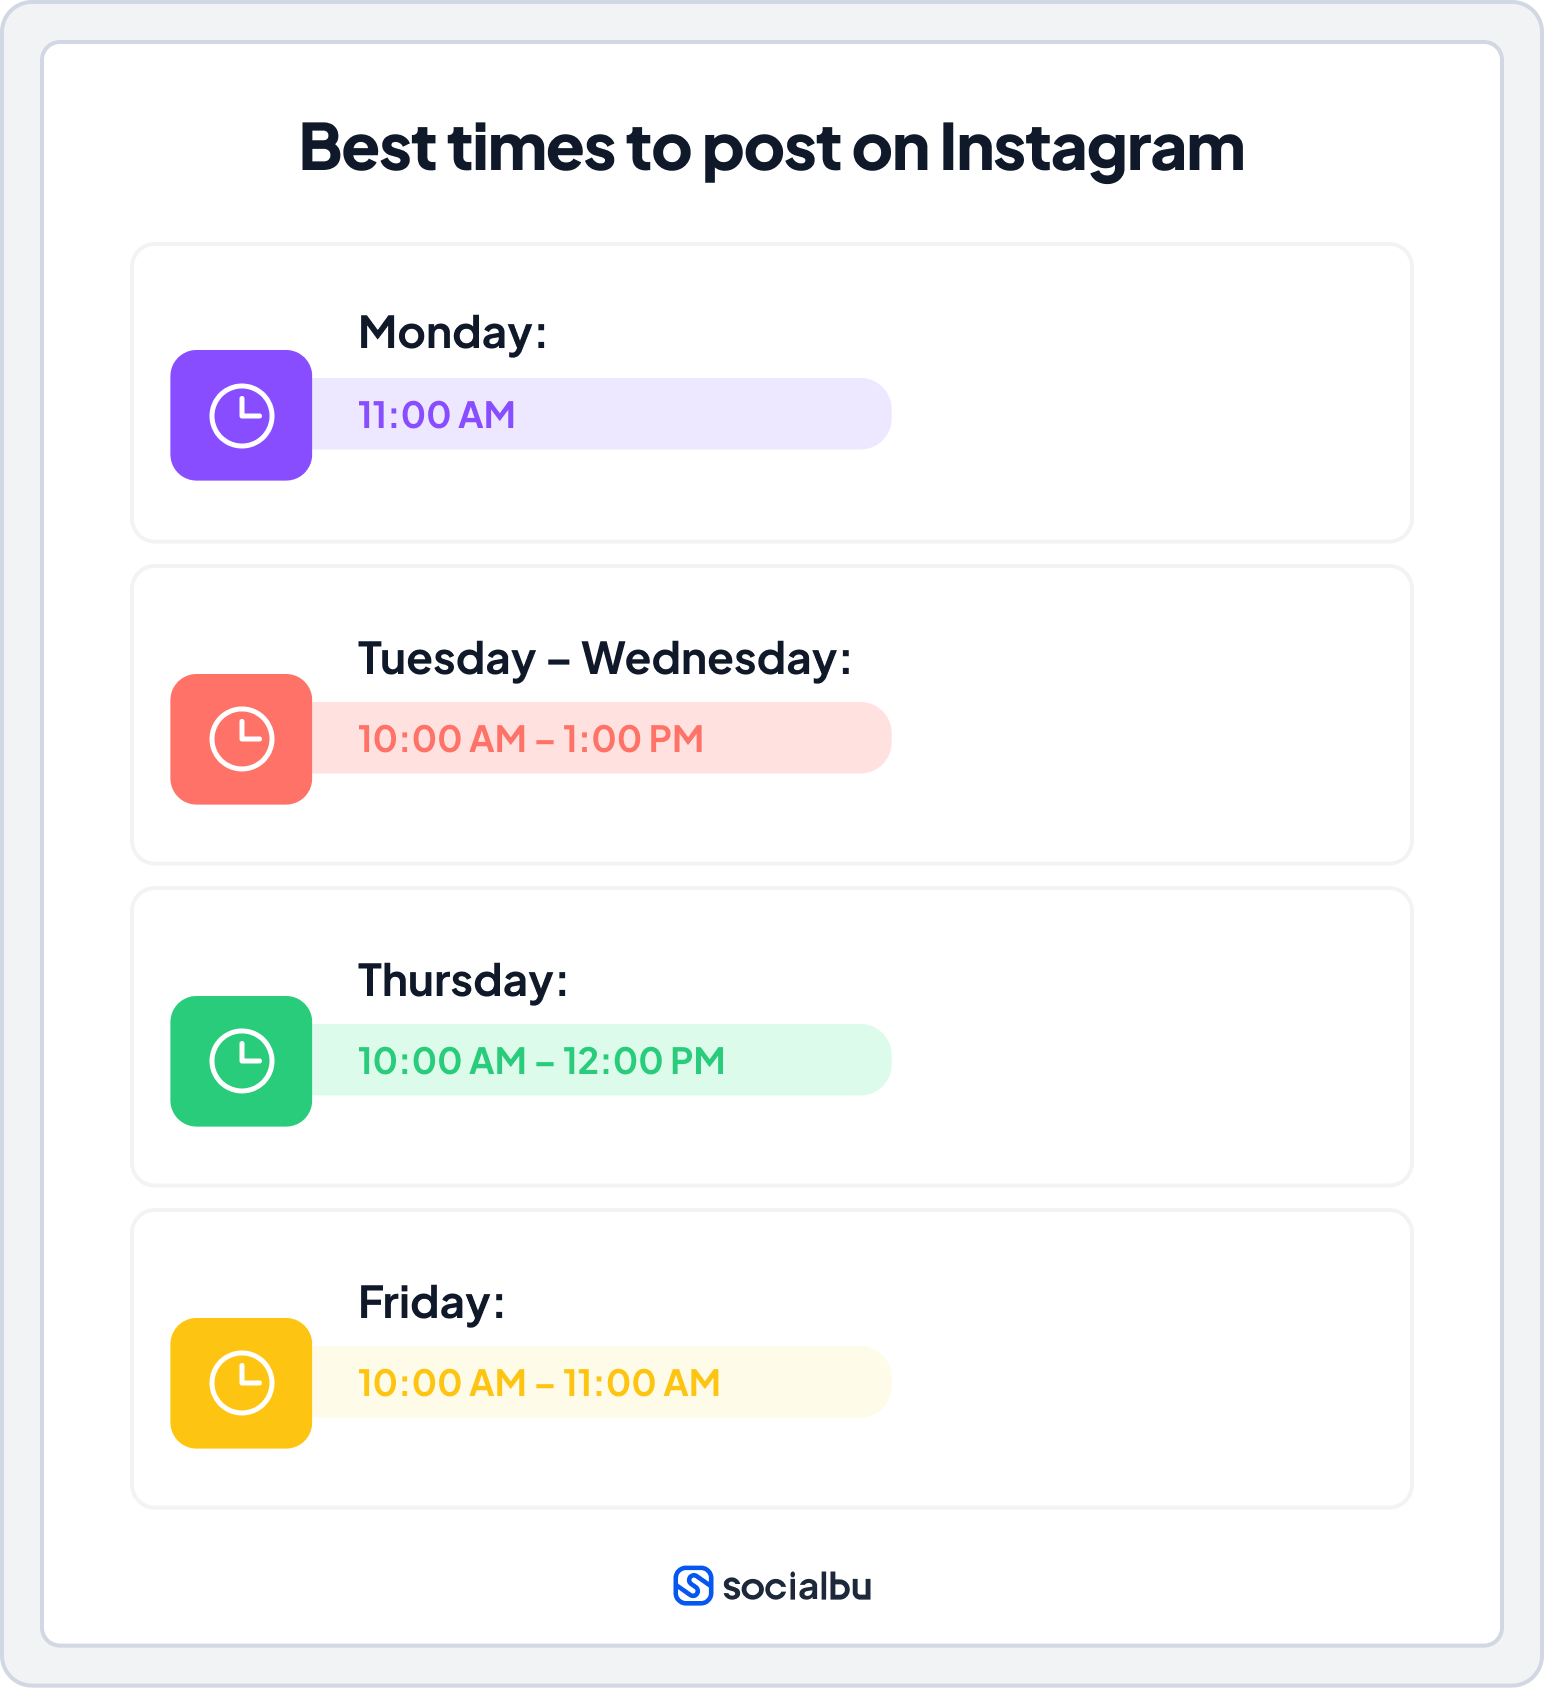
21. The Best Times to Post are Mid-Morning on Weekdays
Posting when your audience is most active gives your content an initial boost in the algorithm.
According to SocialBu’s analysis, the universally best times to post on Instagram are:
What This Means for You:
A successful content strategy uses a mix of formats. You need Reels to reach new people, Carousels to teach and engage your current followers, and Instagram Stories to build a personal connection.
Instagram Statistics for Business & Shopping
Instagram is no longer just a photo-sharing app; it has evolved into a comprehensive hub for discovery, shopping, and brand interaction.
22. 200 Million Users Visit a Business Profile Daily
An incredible 200 million users visit at least one business profile every single day. This shows the audience’s apparent intent to engage and learn more about products and services from brands or influencers on the platform.
23. 44% of Users Shop on Instagram Weekly
Instagram has seamlessly integrated shopping into the user experience, making it a powerful sales channel.
According to Instagram’s own research, 44% of users interact with shoppable content or browse for products at least once a week.
Features like product tags, the “Shop” tab, and in-app checkout make it easier than ever to convert followers into customers.
24. Instagram Strongly Influences Purchase Decisions
If your products aren’t discoverable on Instagram, you’re missing a key revenue driver.
Instagram influences more consumer purchasing decisions than TikTok, Facebook, or Pinterest, second only to YouTube.
What This Means for You:
Your followers aren’t just there to see pretty pictures; they are ready to shop. The platform is designed to turn discovery into a purchase.
Instagram Statistics: Influencer Marketing
Influencer marketing continues to thrive, with authenticity and smaller creators leading the way.
25. Instagram Remains the #1 Platform for Influencer Marketing
The platform’s visual nature, diverse content formats, and vast creator tools make it the number 1 platform for brand collaborations and influencer marketing.
26. Nano-Influencers Dominate Instagram
Authenticity is winning; you don’t need a massive budget to succeed.
Nano and micro-influencers often have higher engagement rates and more dedicated communities.
- Nano-influencers (1k–10k followers) make up 75.9% of all influencers.
- Micro-influencers (10k–100k followers) account for 13.6%.
These creators have higher engagement rates and a more dedicated community.
For brands, this means cost-effective collaborations with high trust value.
Explore our guide to influencer marketing to learn more.
27. Smaller Accounts are Growing the Fastest
The algorithm favors fresh content, creating a massive opportunity for emerging brands to gain traction.
The fastest-growing accounts in 2025 are still in the 1k–50k follower range.
- 1k–5k followers: 38% average follower growth
- 5k–10k followers: 35% average follower growth
- 10k–50k followers: 33.8% average follower growth
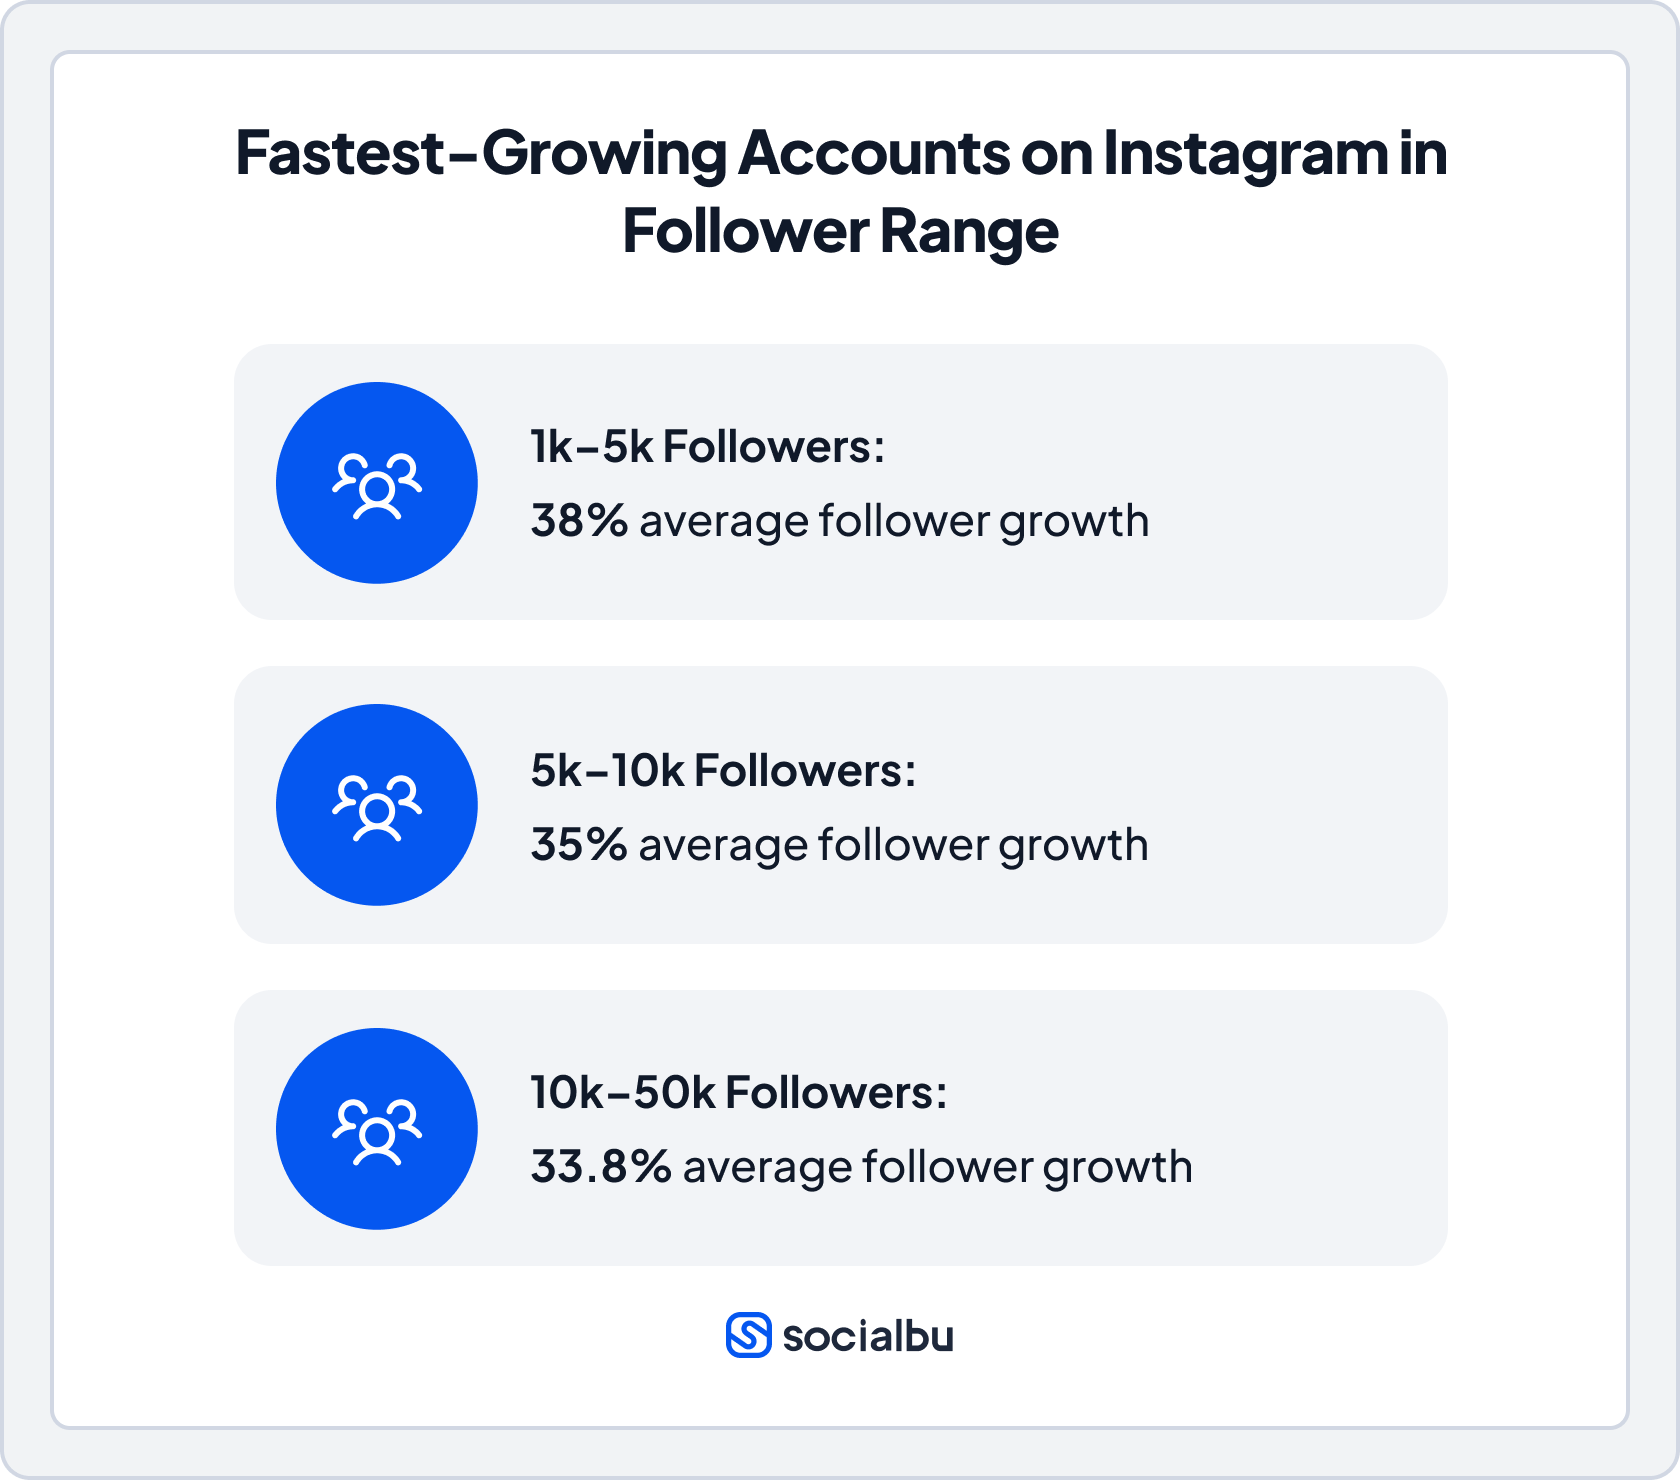
This signals a significant opportunity for new and small brands to gain traction quickly with a strategic content approach.
28. Reels Drive the Highest Engagement for Influencers
Reels must be at the core of your influencer collaborations in 2025.
Influencers see the best results on Reels, with an average engagement rate of 2.08%, outperforming both carousels (1.7%) and static images (1.17%).
What This Means for You:
You can have a successful influencer marketing strategy without spending a fortune on celebrities. Smaller creators offer more trust and better engagement for a lower cost.
Put These Instagram Statistics Insights Into Action
You now have the data-backed blueprint for Instagram success in 2025. You know to prioritize Reels for reach, Carousels for connection, and when to post for maximum impact.
But these Instagram insights are useless without execution.
The next step is to turn this plan into a consistent and manageable workflow.
SocialBu is the all-in-one social media scheduling platform that turns your strategy into an automated growth engine. It can help you:
- Schedule your entire content calendar.
- Automate repetitive tasks via rule-based actions.
- Track performance with simple analytics
- Manage all DMs and comments in one inbox
- Streamline your team’s workflow
So, test SocialBu today and put these Instagram statistics insights into action.
Turn These Insights Into Real Instagram Growth
Frequently Asked Questions
How many active users does Instagram have in 2026?
As of early 2025, Instagram has over 3 billion monthly active users and more than 2.2 billion daily active users, making it one of the top 4 global social platforms.
Which age group dominates Instagram in 2026?
The 18-34 age group remains the dominant demographic, accounting for over 60% of Instagram’s total user base. The single largest demographic segment is individuals aged 25-34.
How effective are Instagram Reels for engagement?
Reels are highly effective for reaching new audiences, generating a median reach of nearly 14%. While Carousels have a slightly higher on-post engagement rate, Reels’ shareability makes them crucial for growth.
How many businesses use Instagram ads in 2026?
While exact numbers fluctuate, over 200 million businesses use Meta’s tools, and millions actively use Instagram ads to reach part of its 1.65 billion-strong advertising audience.
Is Instagram still growing compared to TikTok?
Yes, Instagram continues to see steady user growth. While TikTok’s growth has been explosive, Instagram’s massive, established base and deep integration with commerce keep it a dominant and growing force.
What is the average engagement rate on Instagram?
The average engagement rate per post on Instagram is approximately 0.5% as of 2026. However, this varies by format, with Carousels performing best at over 0.7%.