Social media reports are essential for tracking how well your content is performing across different platforms. Creating these reports manually can be time-consuming and repetitive. Plus, doing it by hand often leads to mistakes or inconsistencies.
That’s why many professionals now prefer automated social media reports. Automation ensures your data is accurate, consistent, and always on time.
This is where SocialBu comes in. It’s a powerful tool designed to automate social media reports with ease. From scheduled reporting to performance summaries and KPI dashboards, SocialBu reporting automation simplifies everything.
With just a few clicks, you can auto-generate social reports using ready-made SocialBu report templates and even export them as PDFs.
Now, let’s move forward and learn how you can automate social media reports.
Cycle of Automated Social Media Reporting
The cycle of automated social media reporting is a smart way to keep track of how your social media is performing, without having to do everything manually.
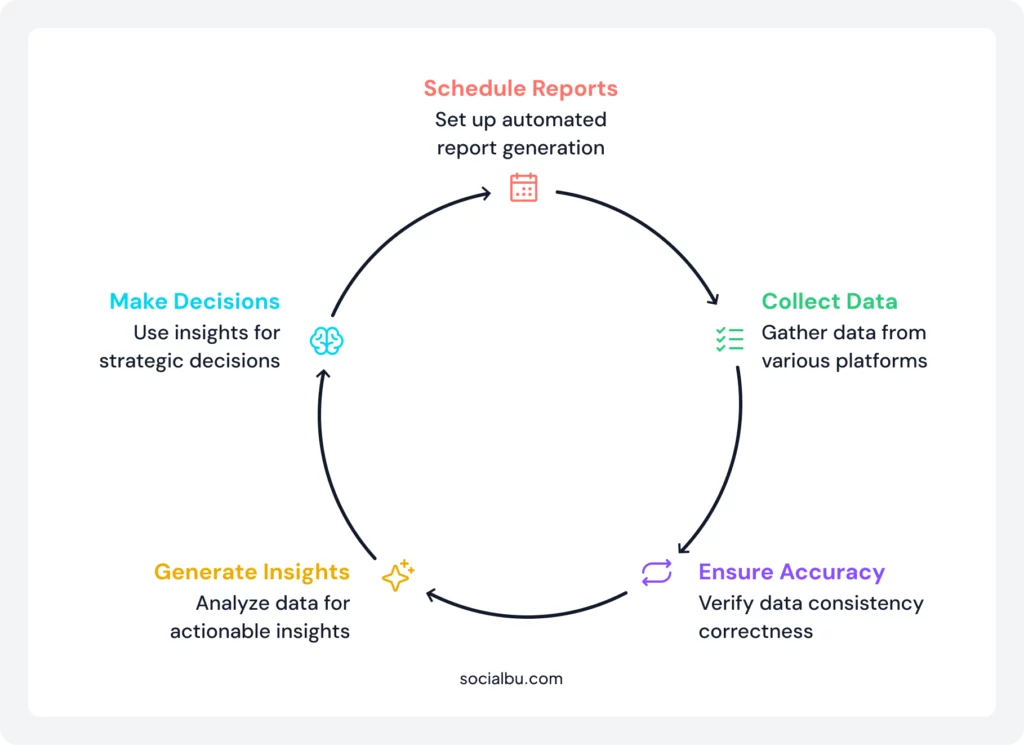
This full cycle saves you time, keeps your reports consistent, and helps you make better decisions for your social media strategy.
Why Automate Social Media Reports?
Creating social media reports manually can be time-consuming and effort-intensive. It often involves copying data from various platforms, verifying numbers, and consolidating everything into a single file. When you automate social media reports, everything becomes easier and faster.
Here are some reasons why you should automate social media reports:
-Consistency and Accuracy in Reporting
-Real-Time Insights for Faster Decision-Making
Types of Social Media Reports
Before we learn how SocialBu helps automate social media reports, it’s essential to understand the types of analytics and reports the platform offers.
Inside the Analyze section of SocialBu, you’ll find four types of social media reports that make it easier to track performance, spot trends, and improve your strategy:
1. Content Performance Reports
These reports show how well your posts are doing across different social networks. With visual analytics like graphs and charts, you can quickly see:
- Engagement compared to the number of posts
- Posting patterns and timing (shown in pie charts)
- Which hashtags perform the best
- Top posts based on likes, shares, and comments
This report helps you plan smarter content using what works best with your audience.
2. Account Performance Reports
Want to know how your social media accounts are growing? These reports focus on your account’s overall activity and include:
- Follower growth over time
- Trends in engagement
- Profile visits and views
- A quick summary of your account’s health
These insights are perfect for tracking long-term progress and audience behavior.
3. Network Performance Reports
This type of report gives you a closer look at how each social media network is performing, like Facebook, LinkedIn, or Twitter. It shows:
- Follower gains or losses
- Page views and overall reach
- Actions taken on your profile (like email or website clicks)
- Audience location, age, and devices used (especially helpful for Google Business Profile)
It’s great for comparing results across platforms and understanding where your audience is most active.
4. Team Performance Reports
If you work with a team or run an agency, these reports help you monitor team efforts. You’ll see:
- Number of replies sent by each team member
- Posts created or scheduled
- Average response time
- Engagement levels per team member
This helps ensure everyone is contributing effectively and keeps collaboration on track.
Why Use SocialBu for Analytics?
SocialBu makes analyzing your social media easy with:
-Visual analytics to track trends without manual tracking
-Insights that help plan better content strategies
-Fast and easy automated PDF export in formats like PDF, PNG, or JPEG
Now let’s take a closer look at how the Analyze feature in SocialBu helps you streamline and improve your social media reports.
Step-by-Step: How the Analyze Feature in SocialBu Works
The Analyze tab in SocialBu is where all your key performance data lives. It gives you visual analytics, performance summaries, and real-time insights, all in one place. Here’s how to use it:
Step 1: Log In and Connect Your Social Accounts
To start analyzing your data:
- Log in to your SocialBu dashboard.
- Connect your social media profiles (Facebook, Instagram, Twitter, LinkedIn, etc.).
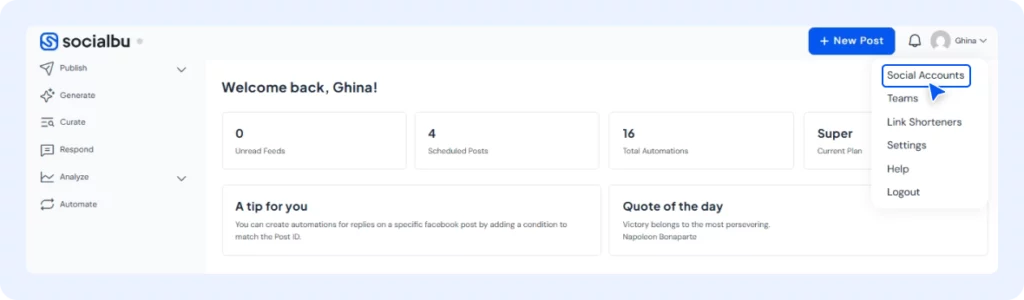
This step ensures SocialBu can collect data from all your platforms to build complete and accurate social media reports.
Step 2: Navigate to the “Analyze” Tab
Once your accounts are connected:
- Go to the Analyze tab from the main menu.
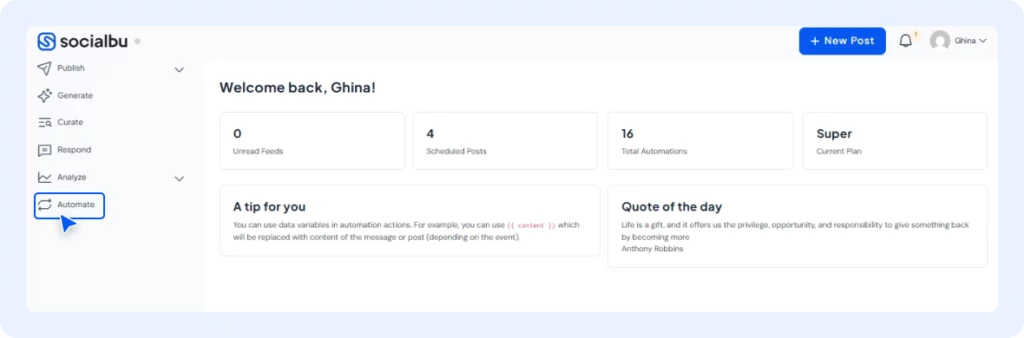
- Choose the social account you want to analyze.
You’ll now see a full overview of metrics like:
- Follower growth
- Engagement rate
- Post reach
- Impressions
- Click-through rates
These are all key data points for creating effective KPI dashboards and performance summaries.
Step 3: Customize Your Reports Your Way
Once your data is loaded, SocialBu allows you to tailor your reports for greater utility. You can:
- Filter data by date (daily, weekly, or custom ranges)
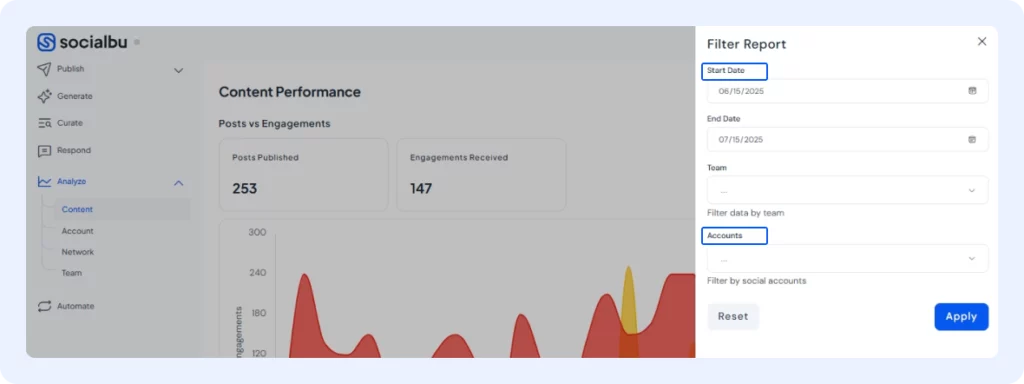
- Compare current numbers with past performance.
- Highlight your best-performing content automatically.
This type of customization ensures that your scheduled reporting remains focused, meaningful, and helpful in making informed decisions.
Step 4: Auto-Generate and Export Reports
Select the ‘Start Date’ and ‘End Date’, choose the accounts you want the report for, and click on ‘Apply’.
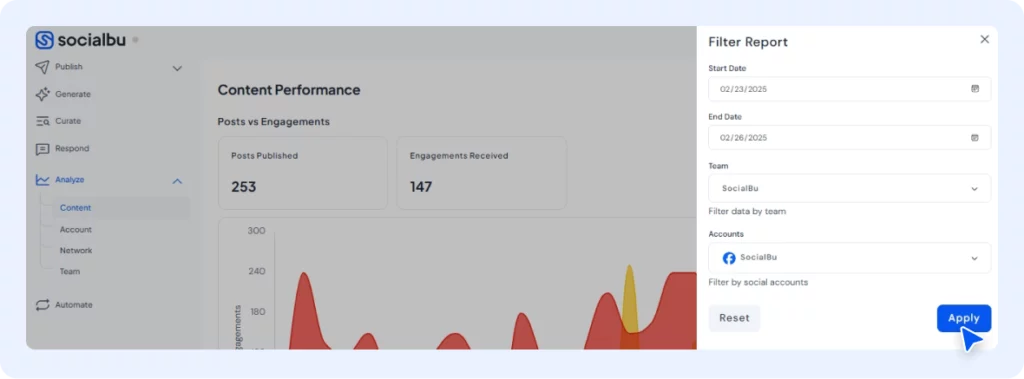
Now that your data is organized:
You can view the social media report, which includes your top posts, content engagement, Hashtag analytics, and publishing behavior. You can also download the social media report in PDF, JPG, or PNG format.
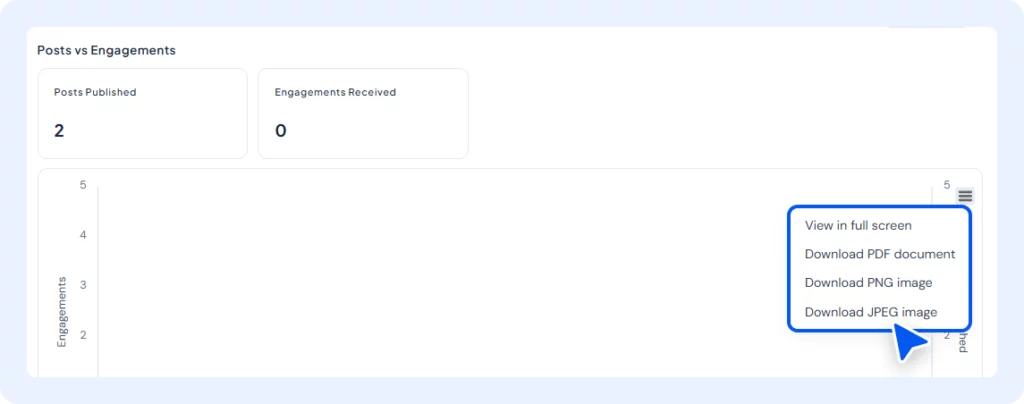
This step transforms complex data into clean, client-ready visuals that are easy to understand.
Why It’s Better with SocialBu?
Here’s what makes SocialBu reporting automation stand out:
- Scheduled Reporting
- Visual Analytics
- Performance Summaries
- KPI Dashboards
- Template Use
- PDF Export
Whether you’re handling one brand or many, SocialBu’s tools help you stay informed without the manual effort.
Conclusion
Automating your social media reports is no longer a luxury; it’s a necessity for anyone serious about growing their online presence. By using SocialBu, you’re not just saving time; you’re gaining the ability to make smarter, data-backed decisions faster than ever.
With features like the Analyze tab, auto-generated reports, and scheduled reporting, SocialBu takes the stress out of analytics and gives you the tools to scale your efforts with confidence.
So if you’re still doing reports by hand, now’s the time to switch.
Let SocialBu reporting automation handle the heavy lifting while you focus on what really matters: growing and engaging your audience.
FAQs
Q: How do I automate social media reporting with SocialBu?
To automate social media reports in SocialBu, simply connect your social accounts, go to the Analyze tab, and select the data range. Then, select the account(s) for which you want reports, and SocialBu will automatically generate social reports instantly.
Additionally, with scheduled reporting, your reports will be automatically created and delivered without manual effort.
Q: What metrics can SocialBu include in its reports?
SocialBu includes all essential social media report metrics, such as:
- Follower growth
- Engagement rate
- Post reach and impressions
- Click-through rates
- Top-performing content
- Hashtag analytics
- Response time (for teams)
- Network-specific data like location, devices, and actions
These insights are shown through visual analytics and organized in clear performance summaries and KPI dashboards.
Q: Can reports be branded and scheduled?
Yes! With SocialBu reporting automation, you can fully schedule social media reports and customize them to fit your brand. Reports can be set to go out daily, weekly, or monthly, automatically.
Q: Are export options available (PDF, CSV)?
Absolutely. SocialBu enables the automated export of your social media reports in PDF, PNG, or JPEG formats.