Latest updates for Best Data Visualization Examples

Fresh curated links around best data visualization examples are collected here so marketers can spot useful updates and turn timely ideas into posts faster.

Recent items include:

  • Data Visualization Examples From Four Newsrooms — DataViz Weekly
  • Efficiently Manage Complex Data Sets with Data Visualization
  • Hand-Picked New Data Graphics in the Wild — DataViz Weekly

Post angles to try

Share the most useful takeaway for your audience.
Turn one article into a quick practical checklist.
Ask your audience how this shift affects their work.
Turn angles into scheduled posts

Fresh articles and ideas

Recent curated links from global sources. Generate one free draft from any story, then use SocialBu to schedule and refine your content calendar.

anychart.com /1 week ago

Data Visualization Examples From Four Newsrooms — DataViz Weekly

We regularly sift through the data visualization that appears online, choose notable projects, and feature them in DataViz Weekly as examples. This time, all four come from newsroo...

Read source
everlaw.com /1 month ago

Efficiently Manage Complex Data Sets with Data Visualization

Efficiently Manage Complex Data Sets with Data Visualization by Giulianno Lopez

Read source
anychart.com /4 days ago

Hand-Picked New Data Graphics in the Wild — DataViz Weekly

Looking for real-world examples of data visualization done well? DataViz Weekly gathers them on the AnyChart blog. We pick projects from what gets published across the web and pres...

Read source
anychart.com /3 weeks ago

Data Visualization Projects to See for Yourself — DataViz Weekly

Good data visualization gets published constantly, and a lot of it scrolls past before anyone notices. DataViz Weekly is our attempt to slow that down. Each Friday we pull a few pi...

Read source
anychart.com /1 month ago

New Interesting Examples of Data Visualization in Action — DataViz Weekly

We continue our regular DataViz Weekly series, in which we gather data visualizations from around the web and select a few we find worth a look. Maybe you will pick up an idea for...

Read source
anychart.com /2 weeks ago

Good Data Visualization, Found and Passed Along — DataViz Weekly

Data visualization is what we work on the rest of the week. On Fridays, we go through what got published around the web, keep the pieces that hold up, and put them in DataViz Weekl...

Read source
anychart.com /1 month ago

Spotlight on Four Notable Data Graphics — DataViz Weekly

Take a look at four data visualization projects we selected from around the web. Bringing that kind of work here as examples is the whole idea behind DataViz Weekly. Here they are:...

Read source
everlaw.com /2 weeks ago

5 Ways to Deliver Greater Value through Data Visualization

5 Ways to Deliver Greater Value through Data Visualizationby Giulianno Lopez...

Read source
anychart.com /1 month ago

Making Raw Data Visible — DataViz Weekly

Raw data is not something people can take in directly. Visualize it and sizes, differences, and anything unusual show up at once. DataViz Weekly is our regular series about recent...

Read source
anychart.com /1 month ago

Recent Charts and Maps Not to Miss — DataViz Weekly

Charts and maps keep finding their way into all kinds of stories, studies, and projects. Each week, we come across plenty of data visualization work, and DataViz Weekly gives us a...

Read source
simplilearn.com /1 month ago

Data Visualization: Why It Is One of The Top Data Skills For 2026 | Simplilearn

Data analysts and other researchers may compile the most valuable and relevant information available, but it's useless if it isn't accessible and comprehensible to clients and user...

Read source
anychart.com /1 month ago

AI Homework, Labor Force, Football Jerseys, and City Trees in Data Visualization — DataViz Weekly

We open far more data visualization projects across the week than we can write about, and four of them end up here on Friday. In DataViz Weekly, we go through each one and the tech...

Read source
flowingdata.com /1 month ago

Trustworthy data visualization

Kieran Healy, a professor of sociology at Duke University, gives an enjoyable lecture…Tags: Kieran Healy, trust

Read source
flowingdata.com /3 weeks ago

вњљ Application of charts and data

This week is about adapting our visualization workflow as the tools change dramatically.Tags: analysis, tools

Read source
simplilearn.com /1 month ago

Google Data Studio vs Tableau: Comparing 2 Top Data Visualization Tools | Simplilearn

We're all familiar with the concept of Big Data, vast volumes of data pulled from countless sources, to eventually be processed into actionable insights for today's businesses. How...

Read source
medium.com /1 month ago

Why a Simple Chart Often Beats a Complex Machine-Learning Model

Visualisation can reveal the answer before modeling even beginsContinue reading on Medium В»

Read source
dev.to /4 weeks ago

62 free, open-source charts for React, Vue, Next.js, and Nuxt

Explore the collections: React / Next.js · Vue / Nuxt A dashboard might start with a line chart and a few bars. Then someone asks why a total changed, where volume drops between s...

Read source
kdnuggets.com /3 days ago

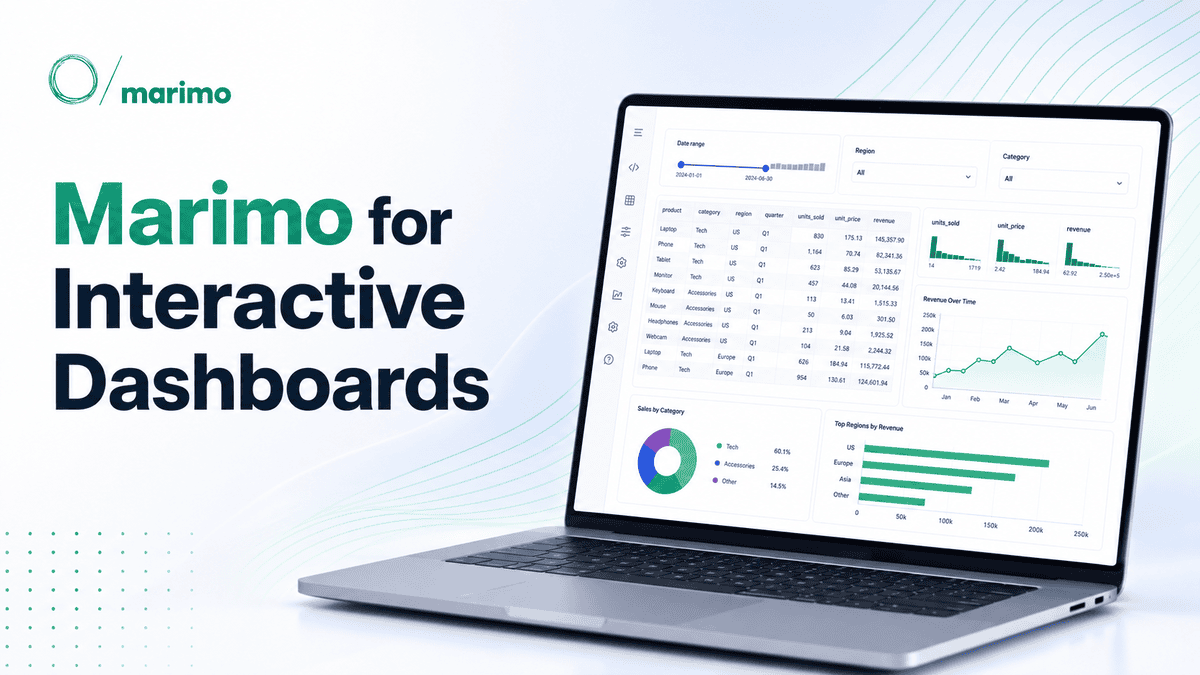
How to Use Marimo for Interactive Data Analysis

Learn how to use Marimo for interactive data analysis with Python, Pandas, and Altair, and turn a reactive notebook into a simple shareable dashboard.

Read source
towardsdatascience.com /4 days ago

How Many Stories Can Your Data Tell?

How the way we represent data can change what we think the data is saying The post How Many Stories Can Your Data Tell? appeared first on Towards Data Science.

Read source
everlaw.com /1 month ago

Challenging Search Terms and Scope of Discovery with Data Visualization

Challenging Search Terms and Scope of Discovery with Data Visualizationby Everlaw .....

Read source
marktechpost.com /1 month ago

Designing Scalable Interactive Visualizations with Reflex XY: Composition, Million-Point Rendering, Streaming, Custom Ma...

Dive into the advanced visualization capabilities of the Reflex XY Python library. This tutorial guides you through building high-performance, interactive charts—from handling mill...

Read source
sourcetrail.com /3 weeks ago

Mastering Telemetry Visualization and Data Management

Unlock the power of your data. Learn how to configure, process, and visualize telemetry to boost performance and security in any industry. The post Mastering Telemetry Visualizatio...

Read source
flowingdata.com /1 month ago

✚ Visualization tools, datasets, and resources — August 2026 roundup

Here is what happened in August.Tags: roundup

Read source
flowingdata.com /1 week ago

✚ Visualization tools, datasets, and learning resources — September 2026 roundup

Here's what happened in September.Tags: roundup

Read source

Turn fresh research into a full content calendar

Use SocialBu to discover ideas, generate post drafts, and schedule them across your social channels.

Sources covering Best Data Visualization Examples

dev.to

Recent coverage from public sources
Public source

flowingdata.com

Recent coverage from public sources
Public source

medium.com

Recent coverage from public sources
Public source

towardsdatascience.com

Recent coverage from public sources
Public source

anychart.com

Recent coverage from public sources
Public source

everlaw.com

Recent coverage from public sources
Public source